IBC Rate Limits: Osmosis IBC Analysis (2/3)
This is part 2 of our research report on bridge security, IBC, and rate limits as safety mechanisms. Built in collaboration with Osmosis.
- Introduction
- State of the Art
- Osmosis IBC Rate Limits (2/3)
- Extending IBC Rate Limits (3/3)
3. Osmosis IBC Analysis
3a. Historical Analysis
In this section, we’ll proceed by exploring the historical data of IBC in Osmosis and how this data can help us determine appropriate rate limits that balance the trade-offs between security and liquidity and user experience.
Osmosis has over 60 blockchains as IBC peers and shares with each one or multiple IBC channels. For the purpose of this report, we’ll focus on the assets and channels that currently present rate limits, namely:
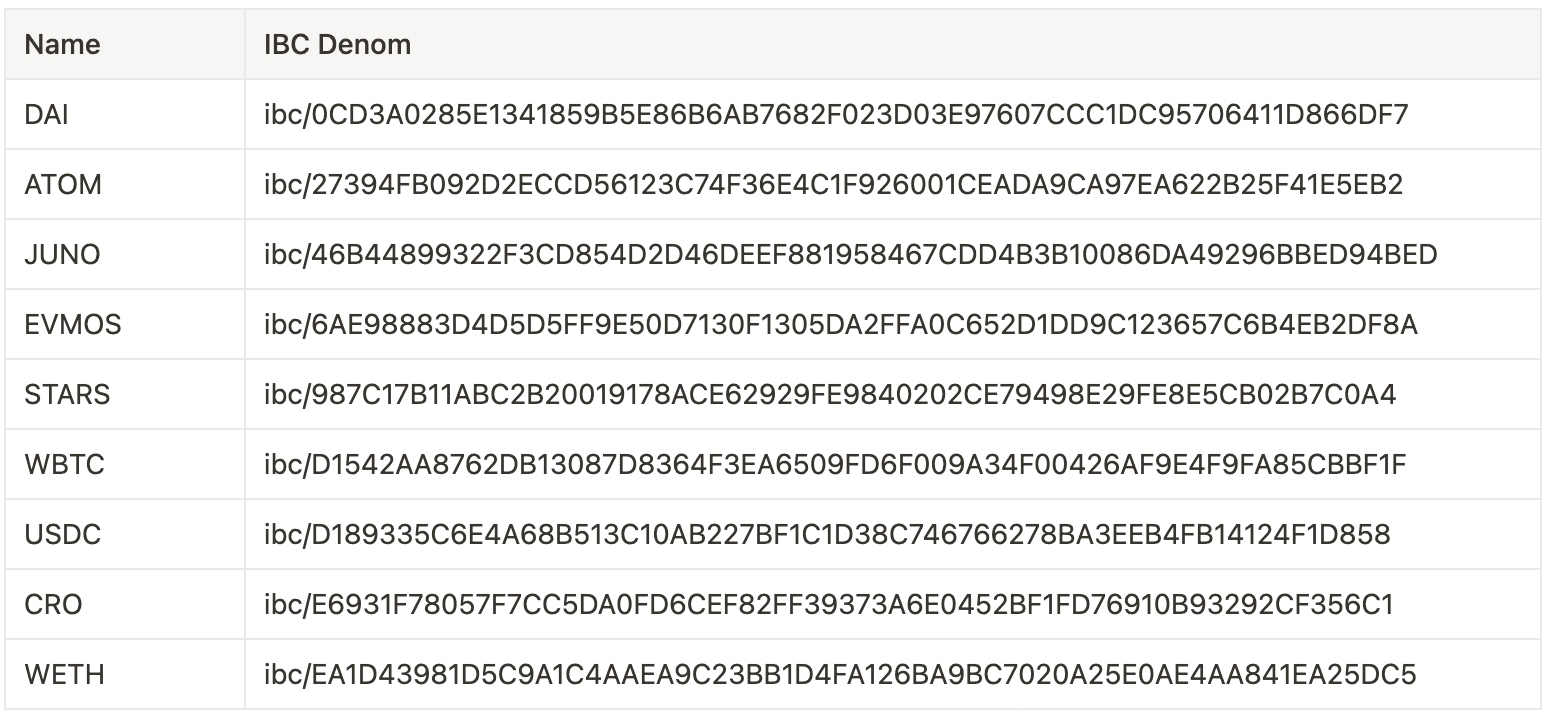
Although each specific channel can be used to transfer different denoms, for the purpose of this study is helpful to label each denom with a rate limit quota with its respective IBC “canonical channel”. Also, across this section we'll use both the chain representation (e.g. uatom) and the asset representation (e.g. ATOM), in which 1 ATOM = 1,000,000 uatom as u -> 10-6.
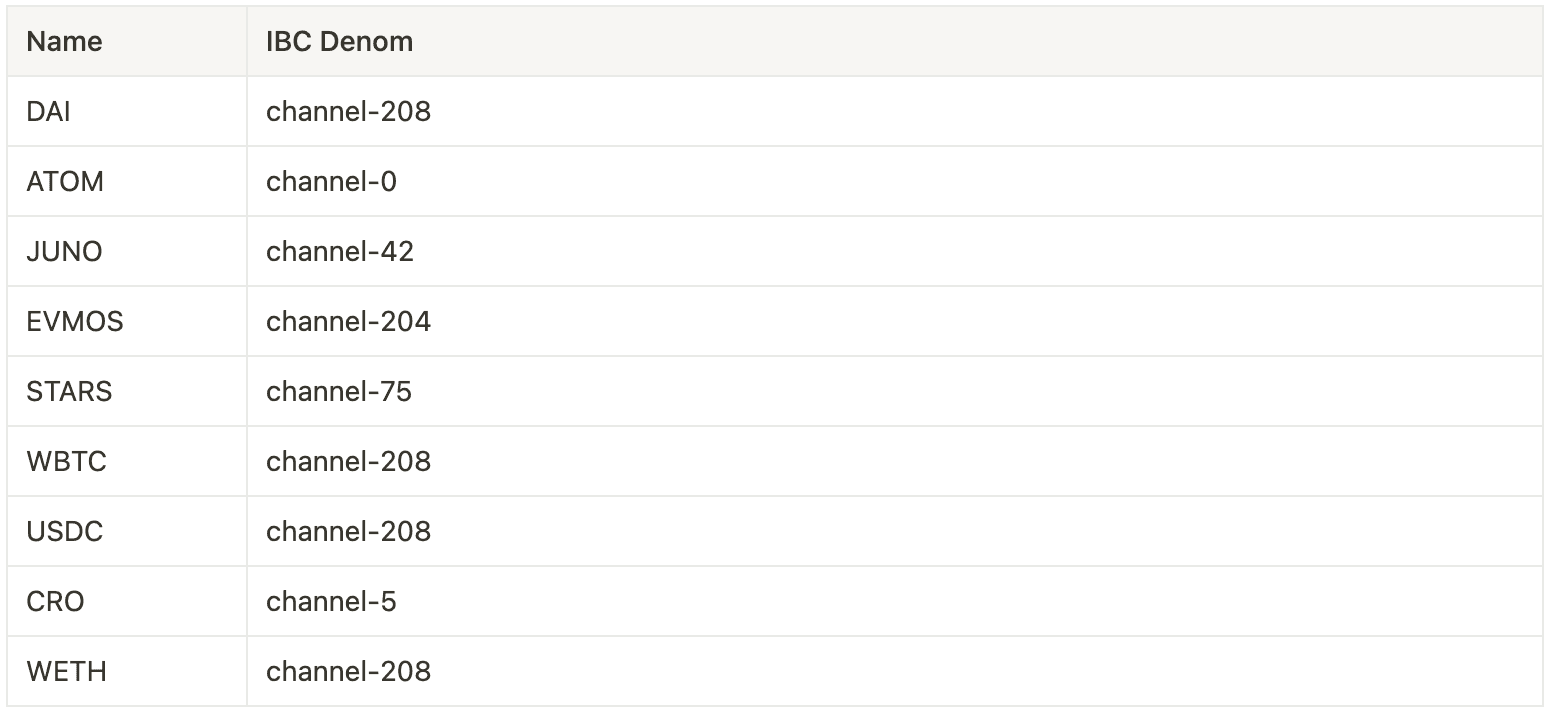
It should be noted that DAI, WBTC, USDC, and WETH share 208 as their canonical channel, as they all are Axelar Wrapped assets.
First, let’s analyze the number of historical total incoming and outgoing IBC transfers:
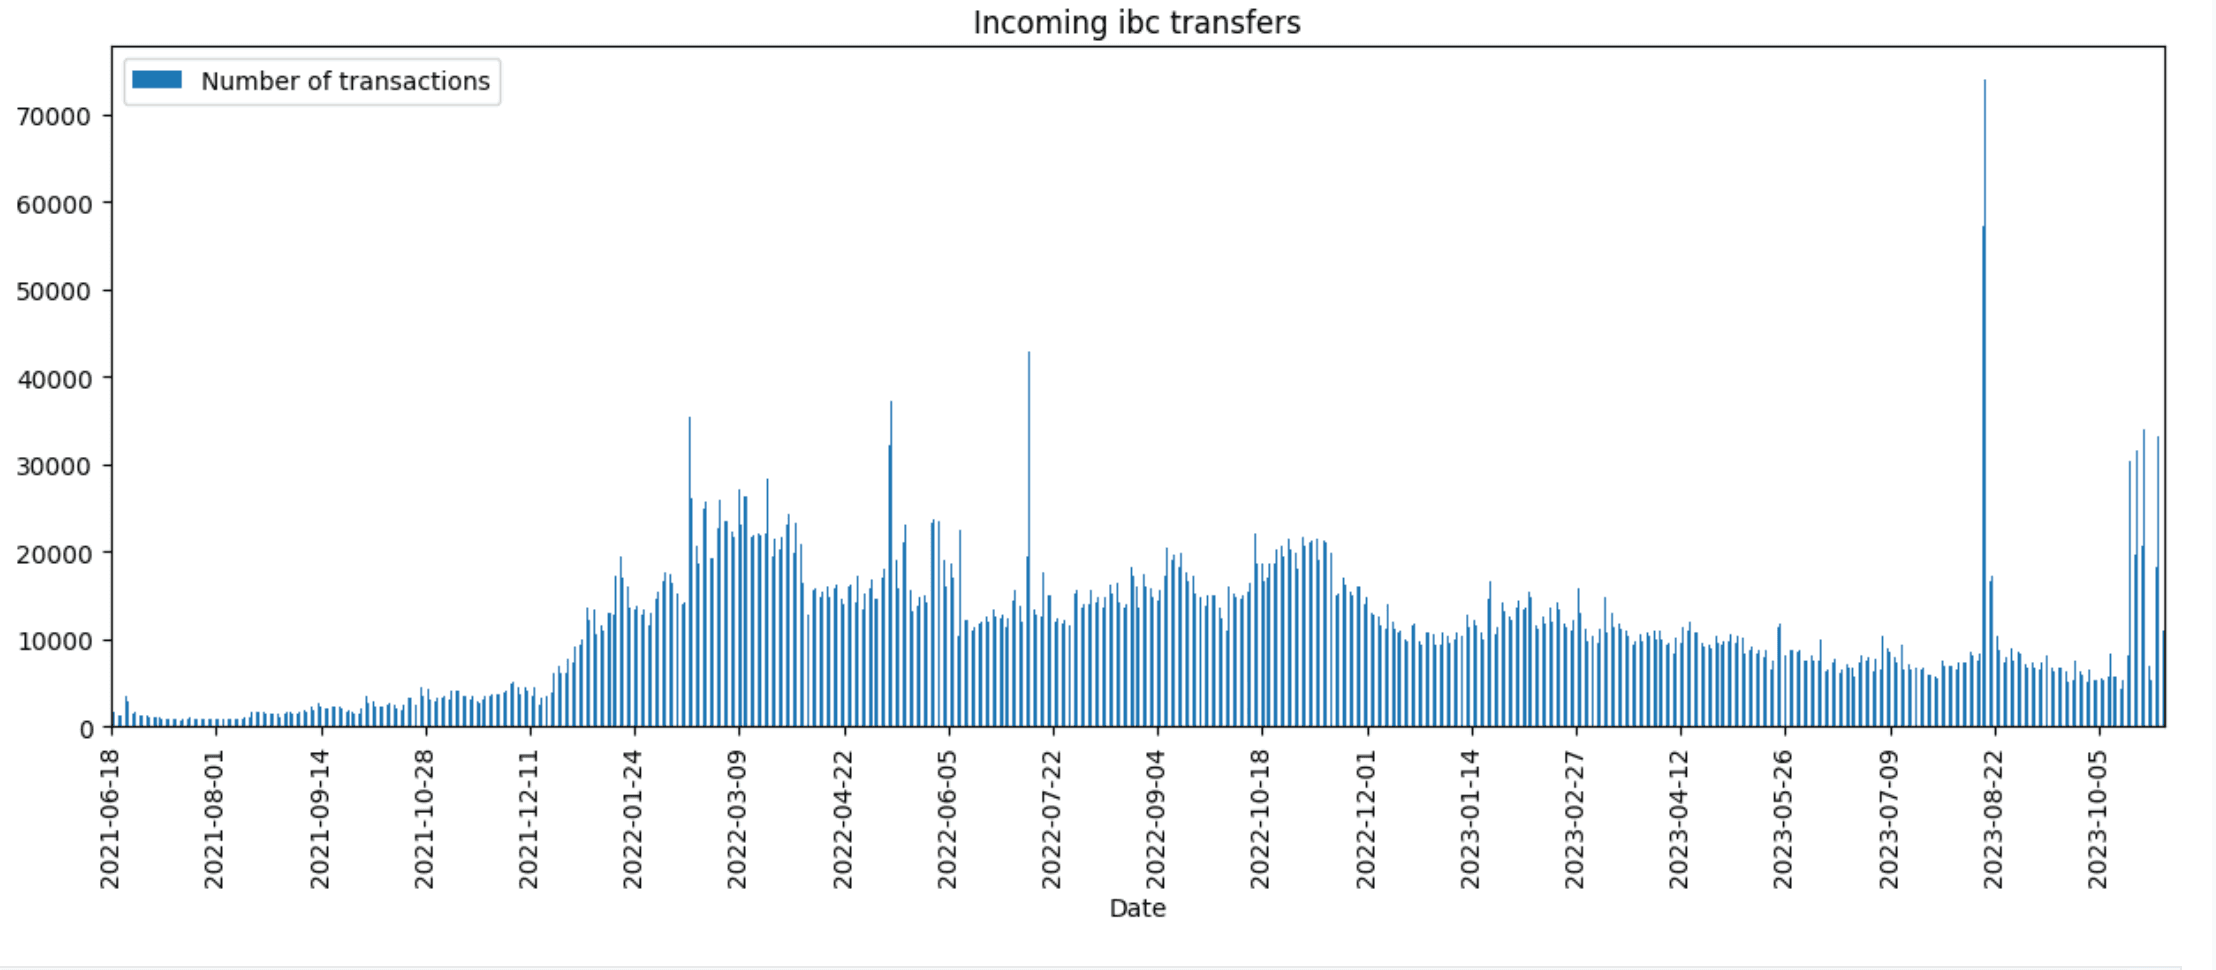
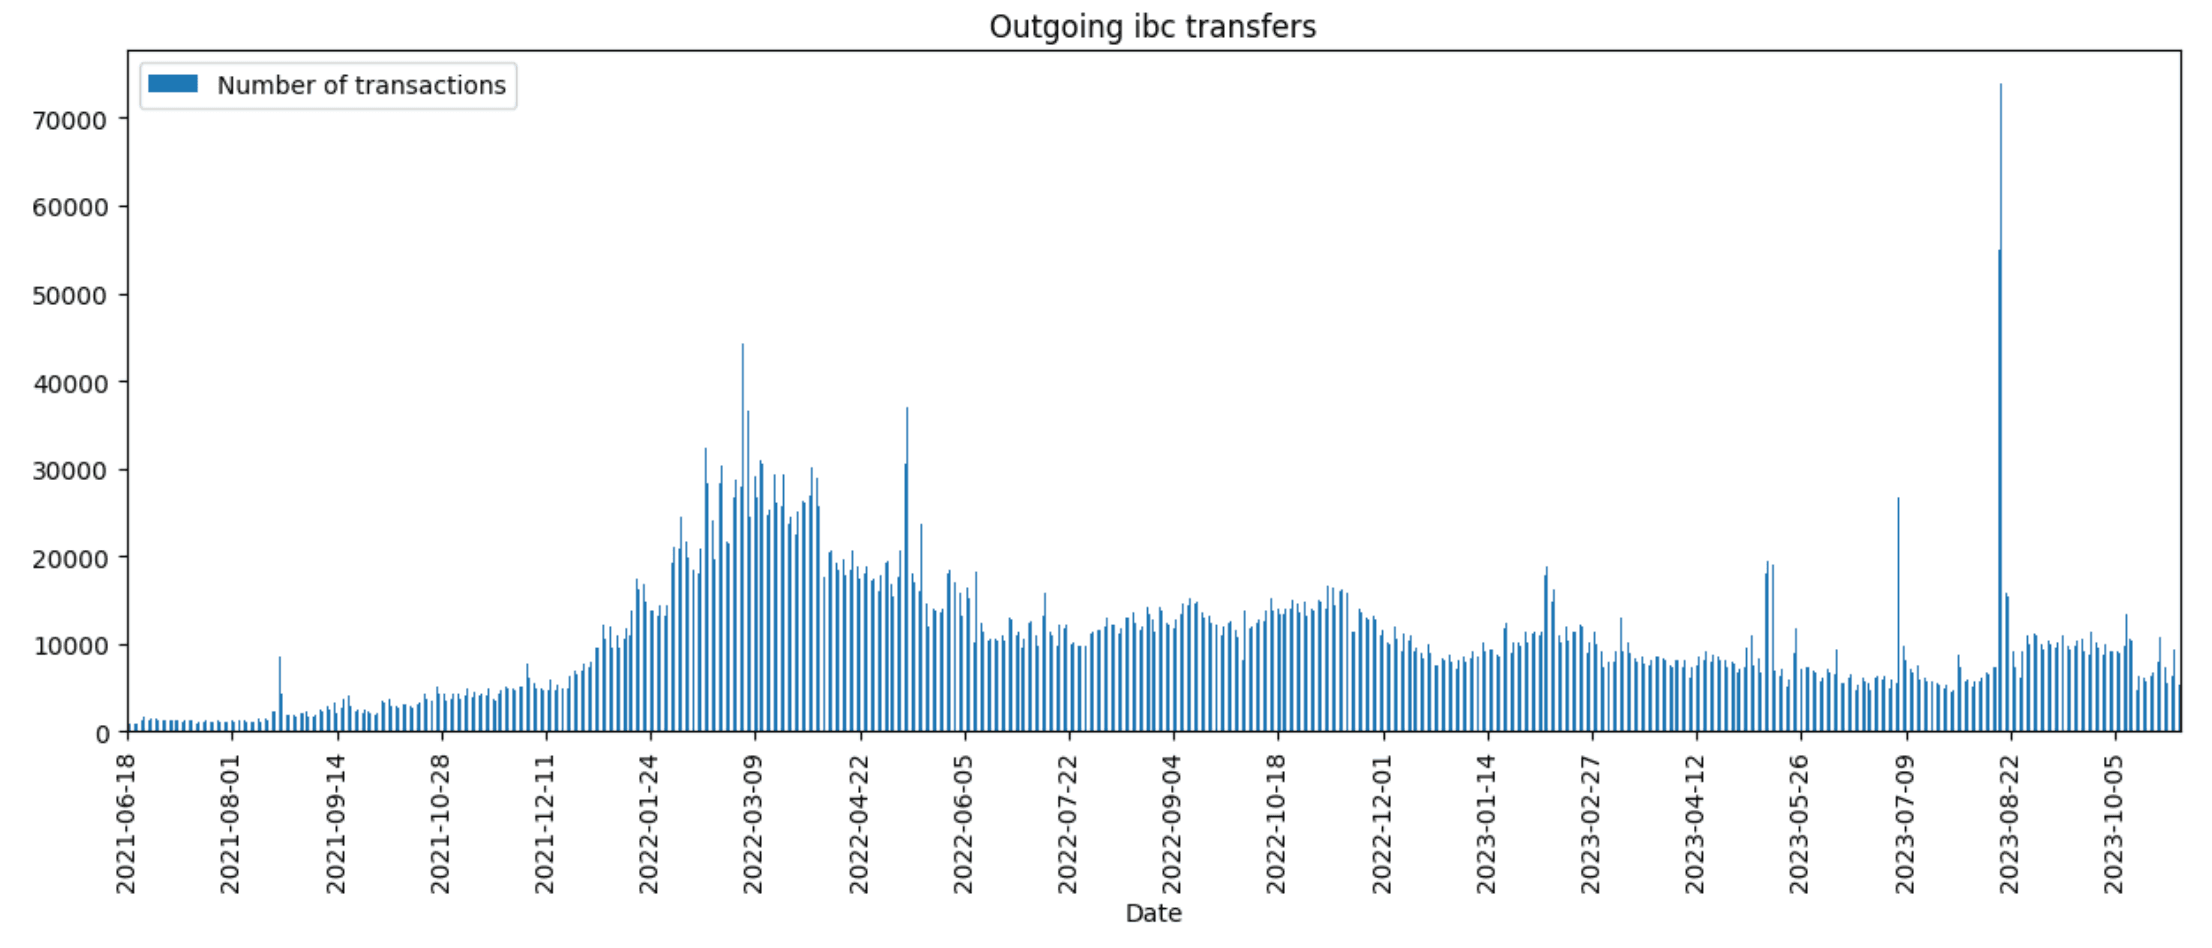
As we can see, the number of transfers is fairly uniform, considering some cyclicality that may be correlated with the market or popularity of the Osmosis chain. However, there are also sharp spikes, like the one occurring in the second half of August, which seems to be caused by the launch of the Sei blockchain and the corresponding trading activity around its token launch.
Now that we have a better sense of the number of transfers let’s analyze the variability of amounts of these transfers by visualizing the largest daily transfers for some of the rate-limited assets:
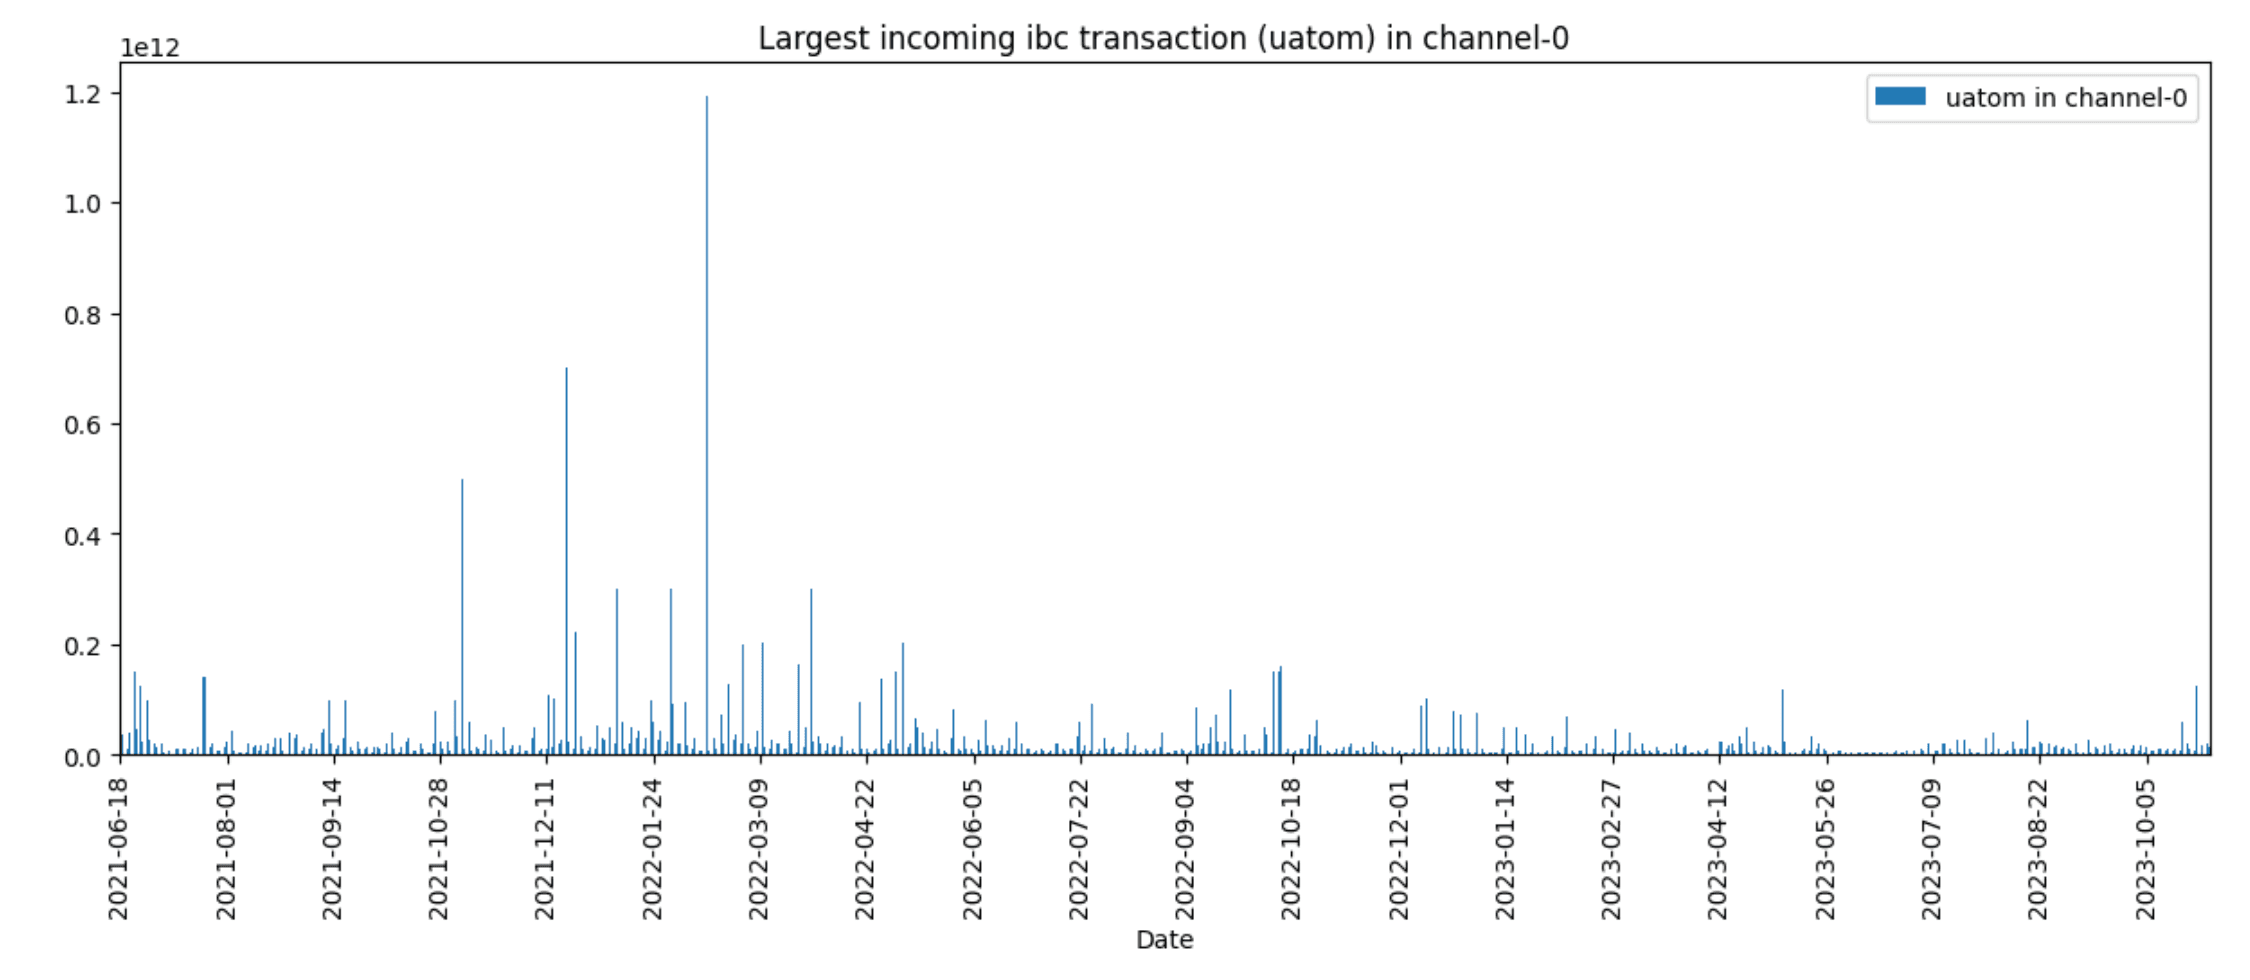
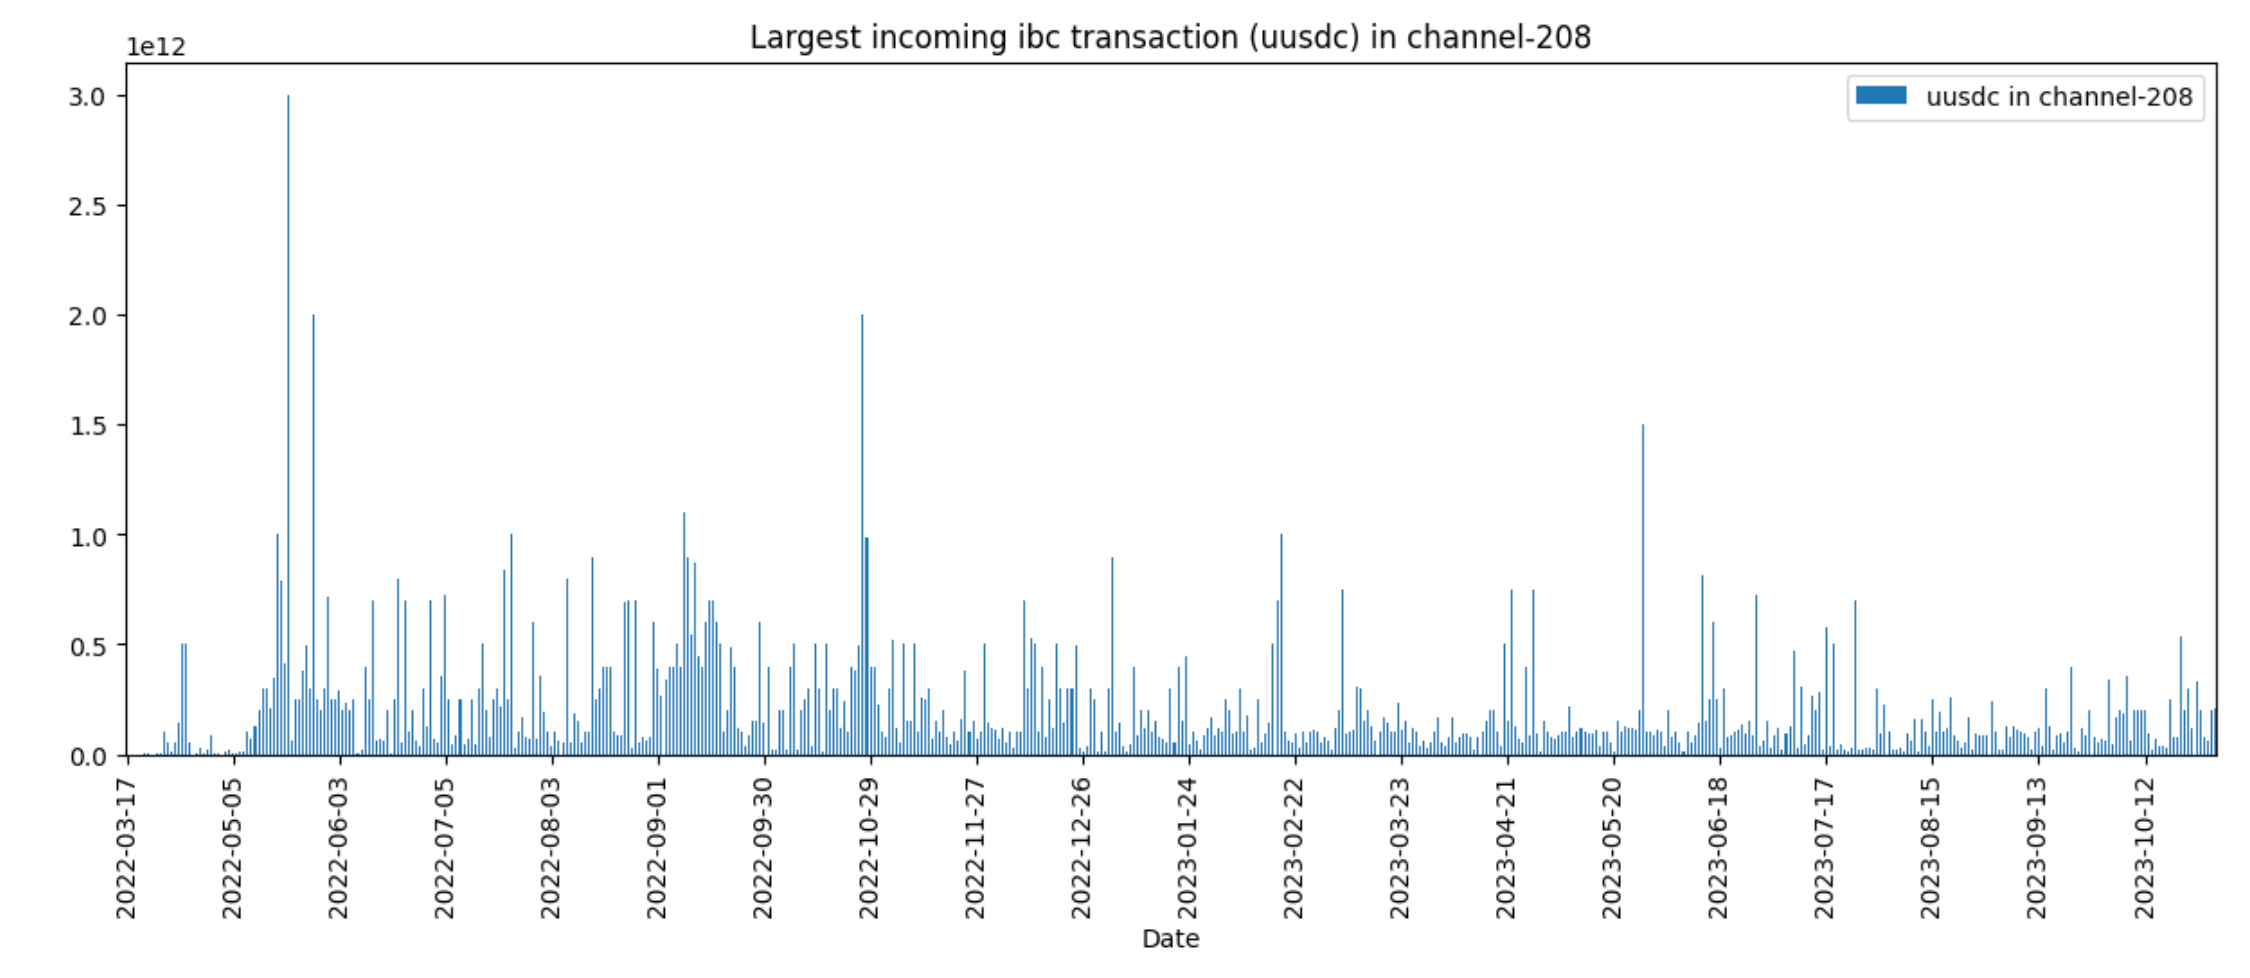
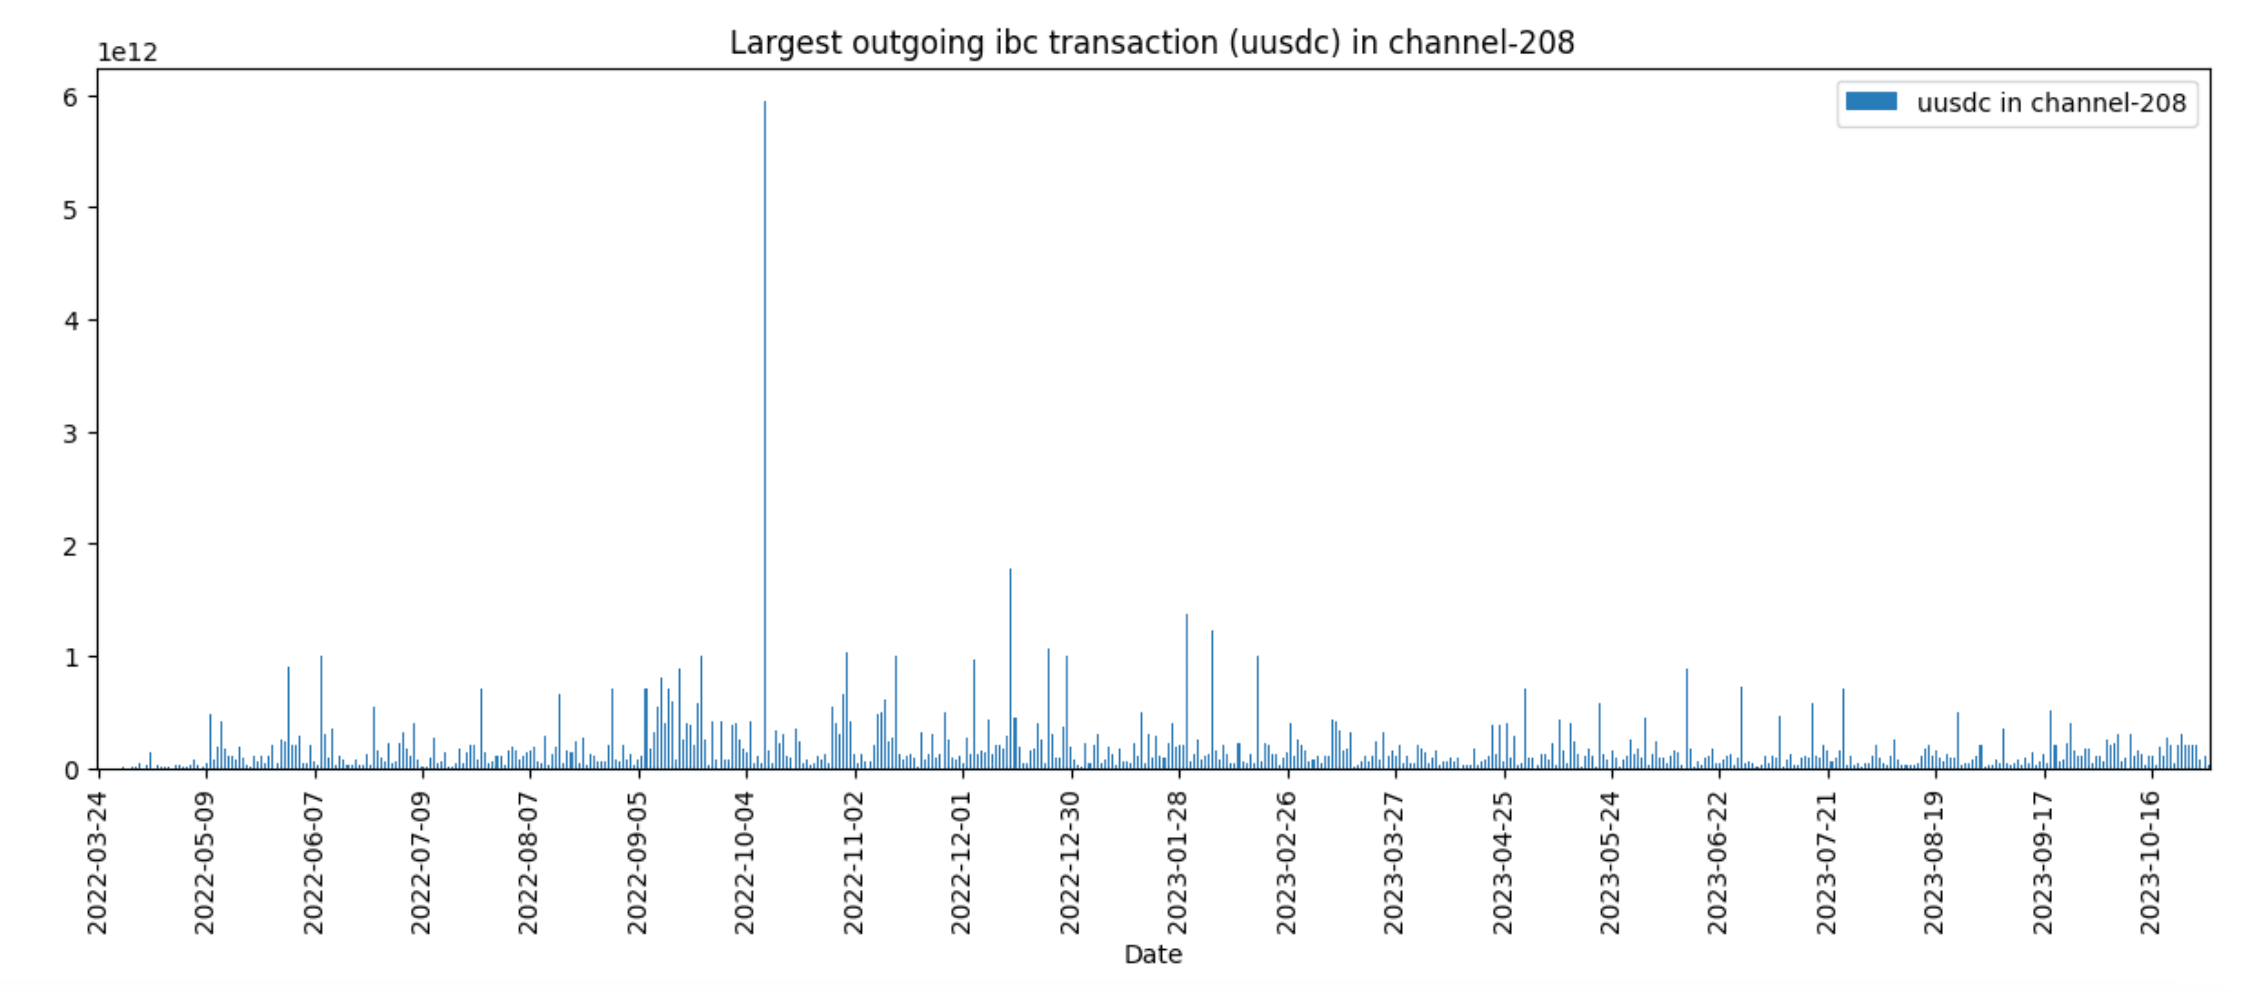
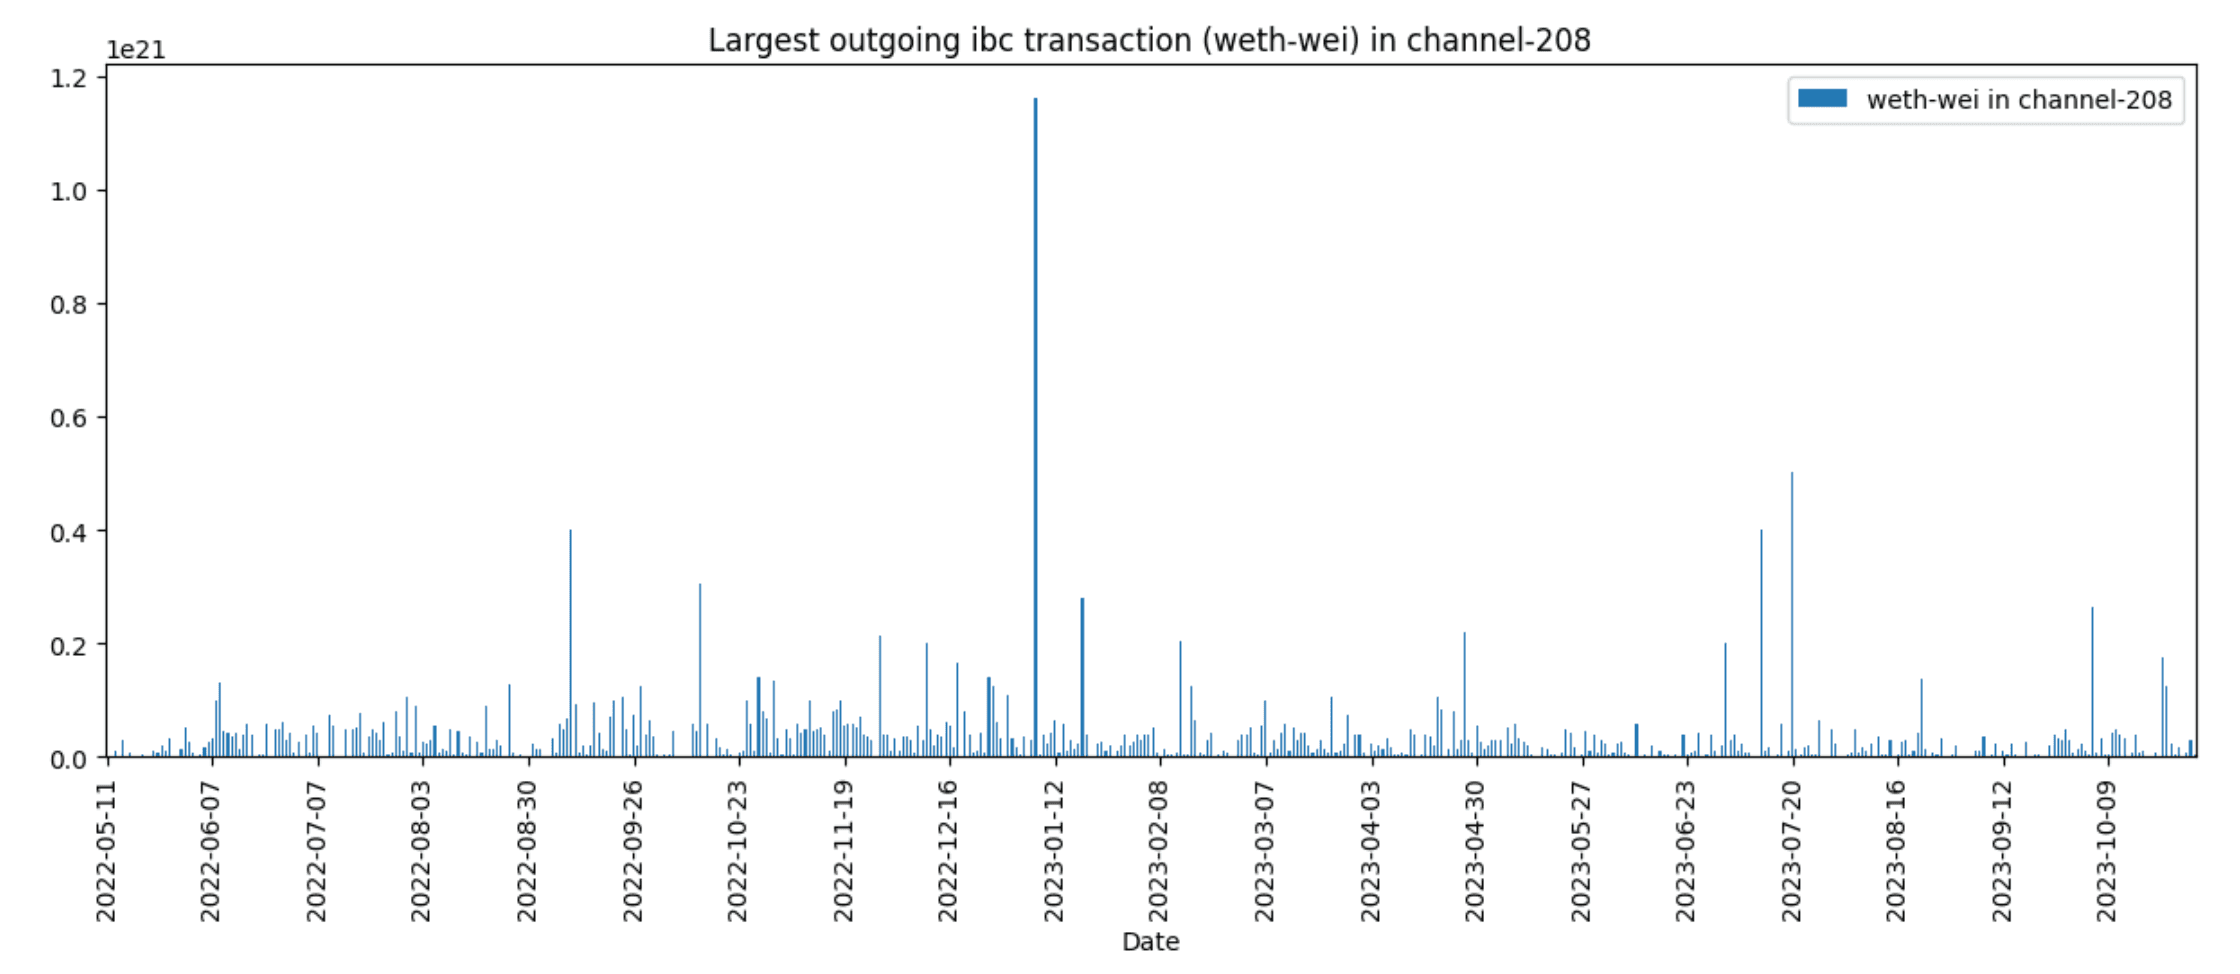
As we can see in the graphs above, there are anomalously large transfers for each of the denoms. These relatively large transfers happened rarely, which could be an argument for the pre-declaration of large transactions without additional overhead to many users.
Even though current rate limits in Osmosis are quantified “in kind,” it’s helpful to show the dollar amount of these large transactions, which may help us determine what’s actually a “large transfer” and incorporate this threshold in future rate limit quotas:
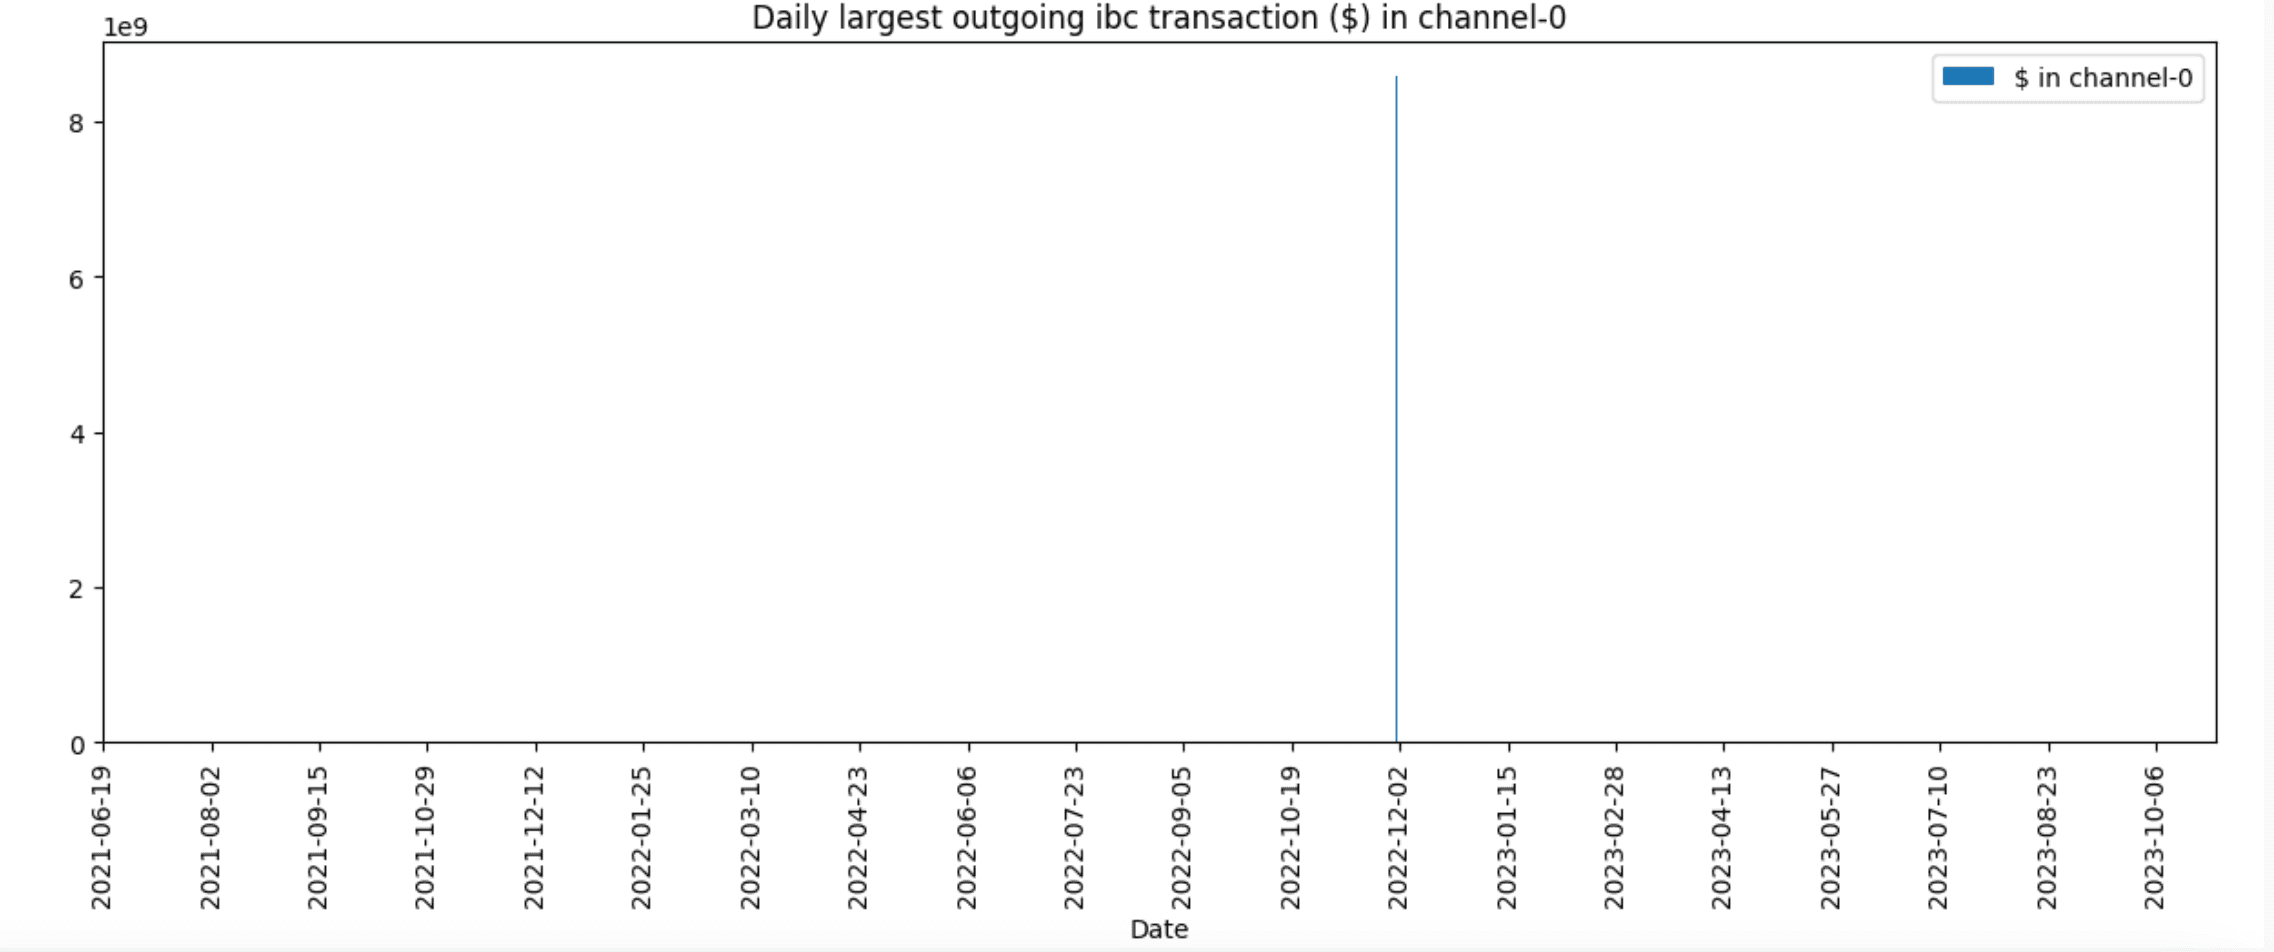
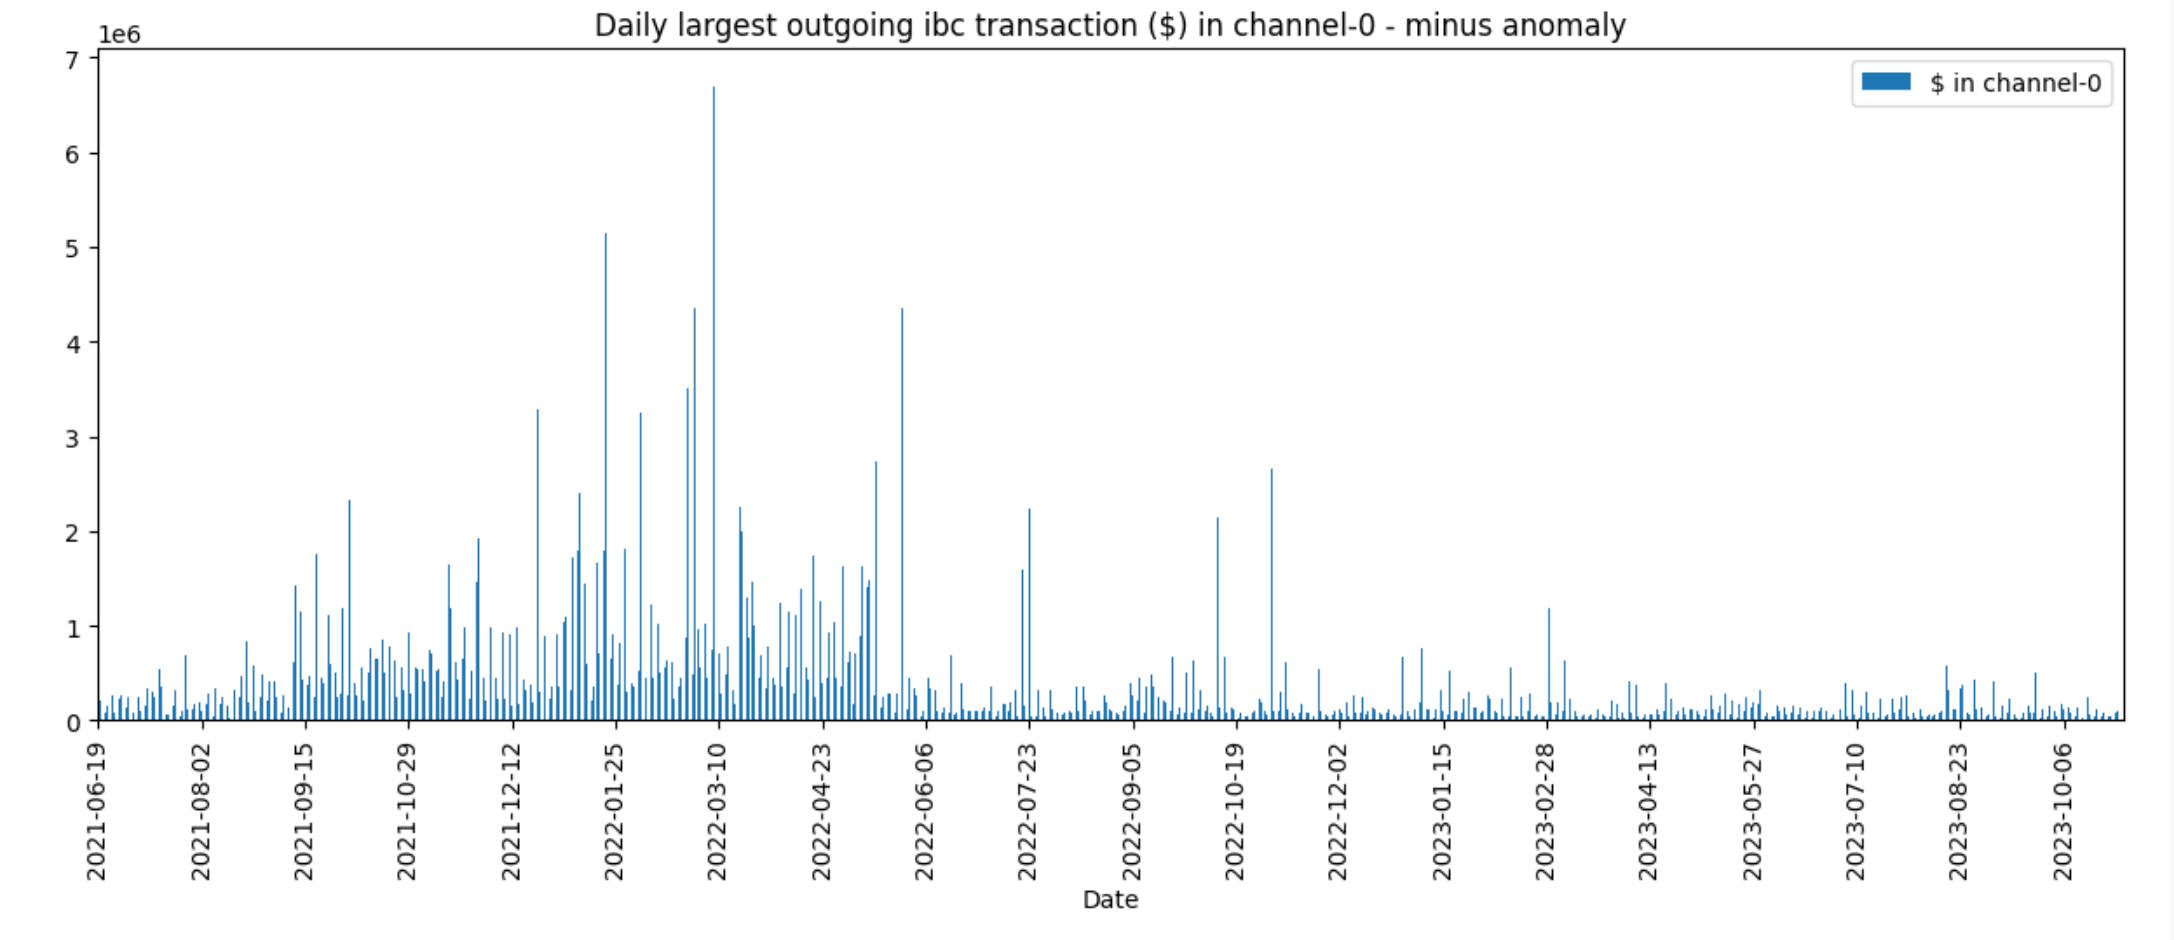
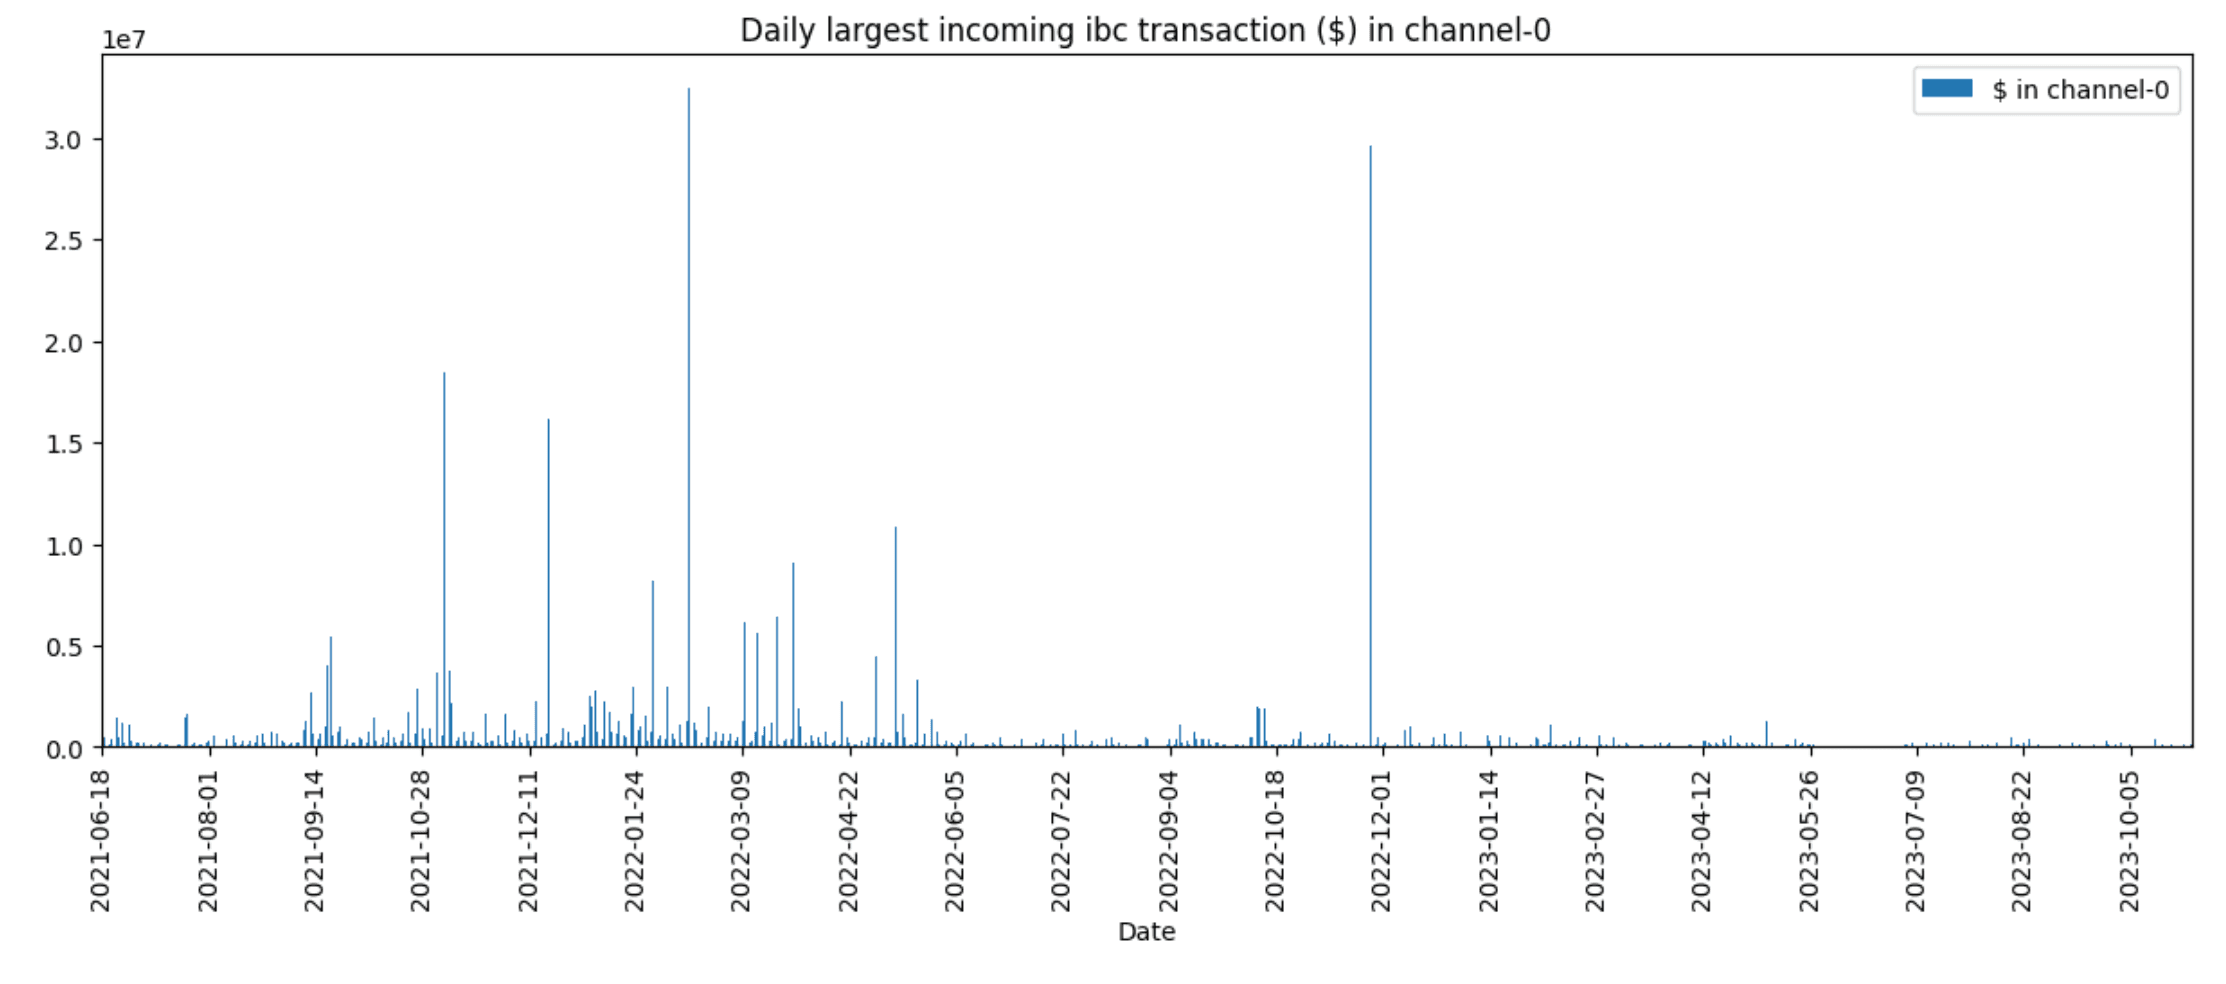
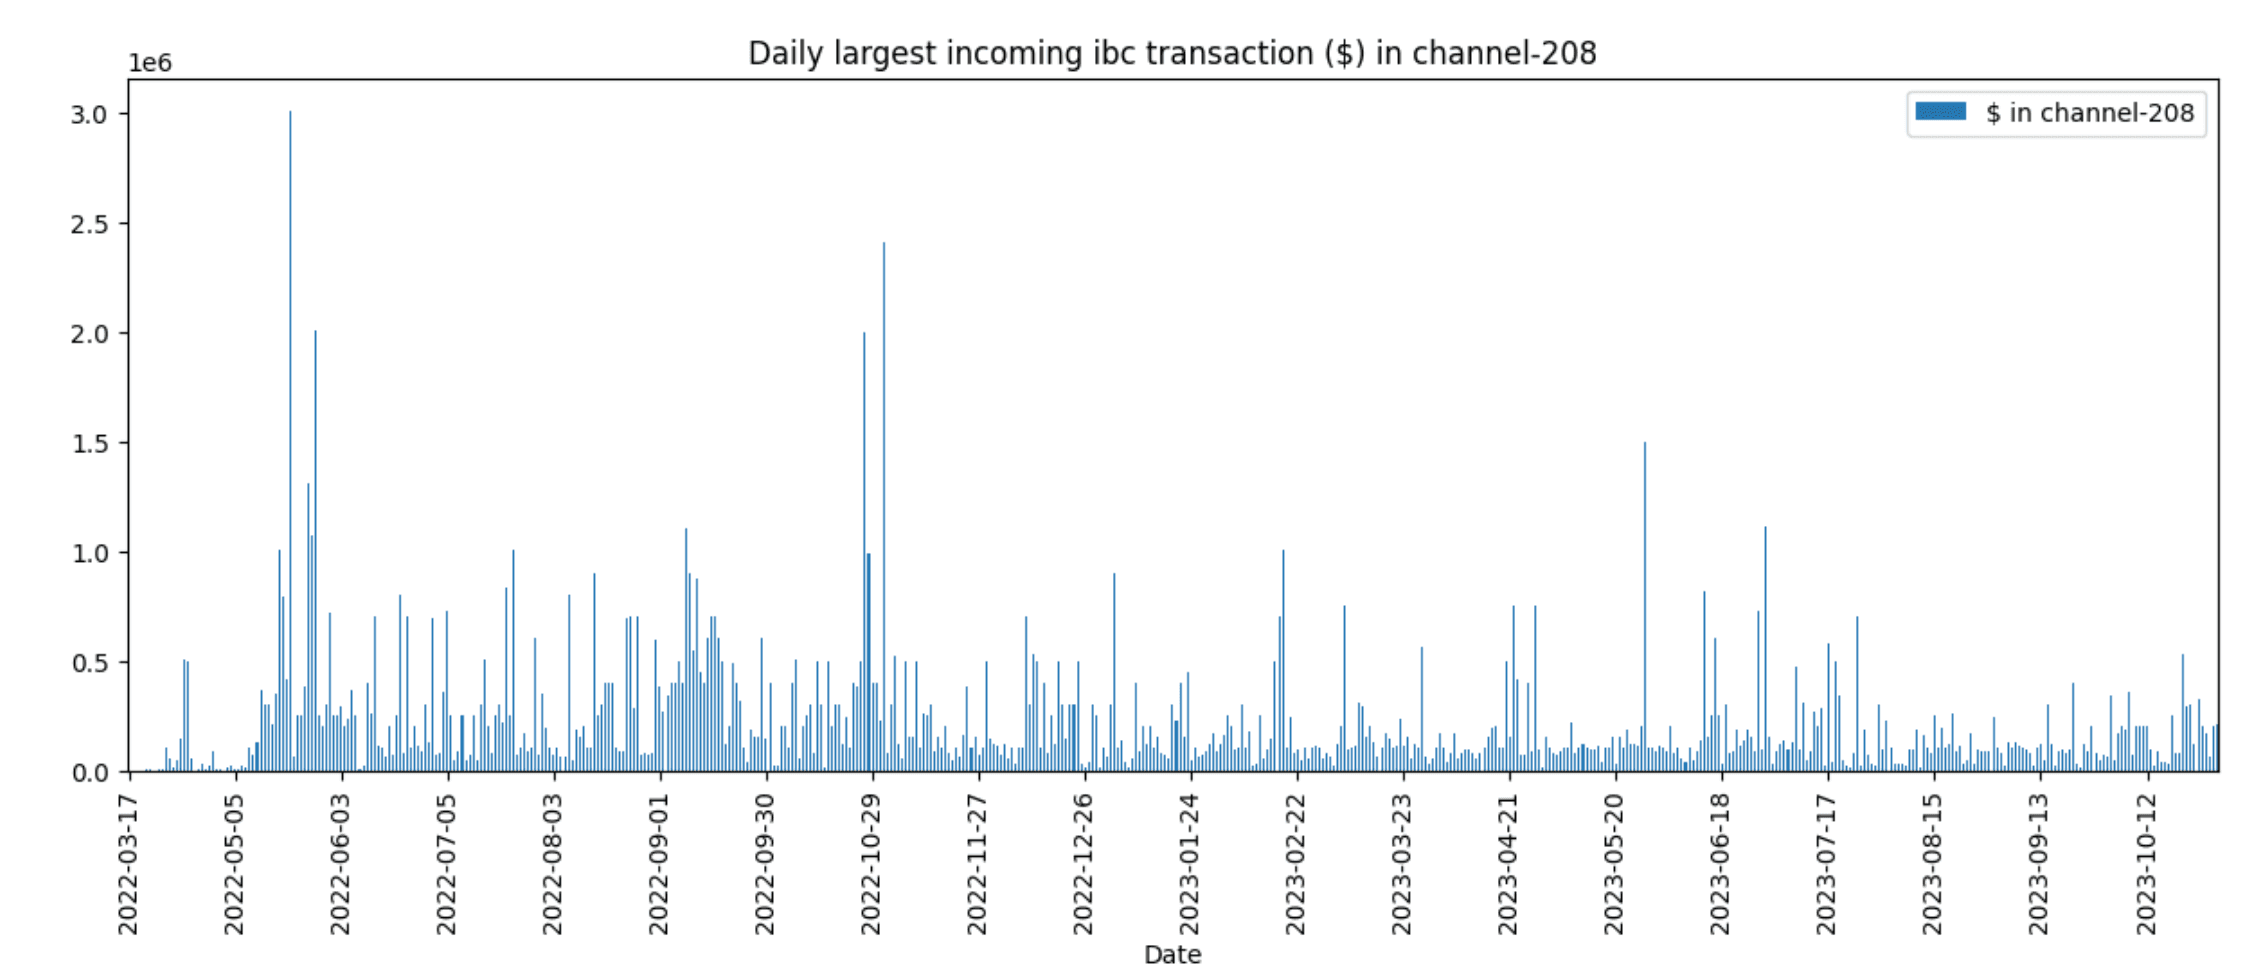
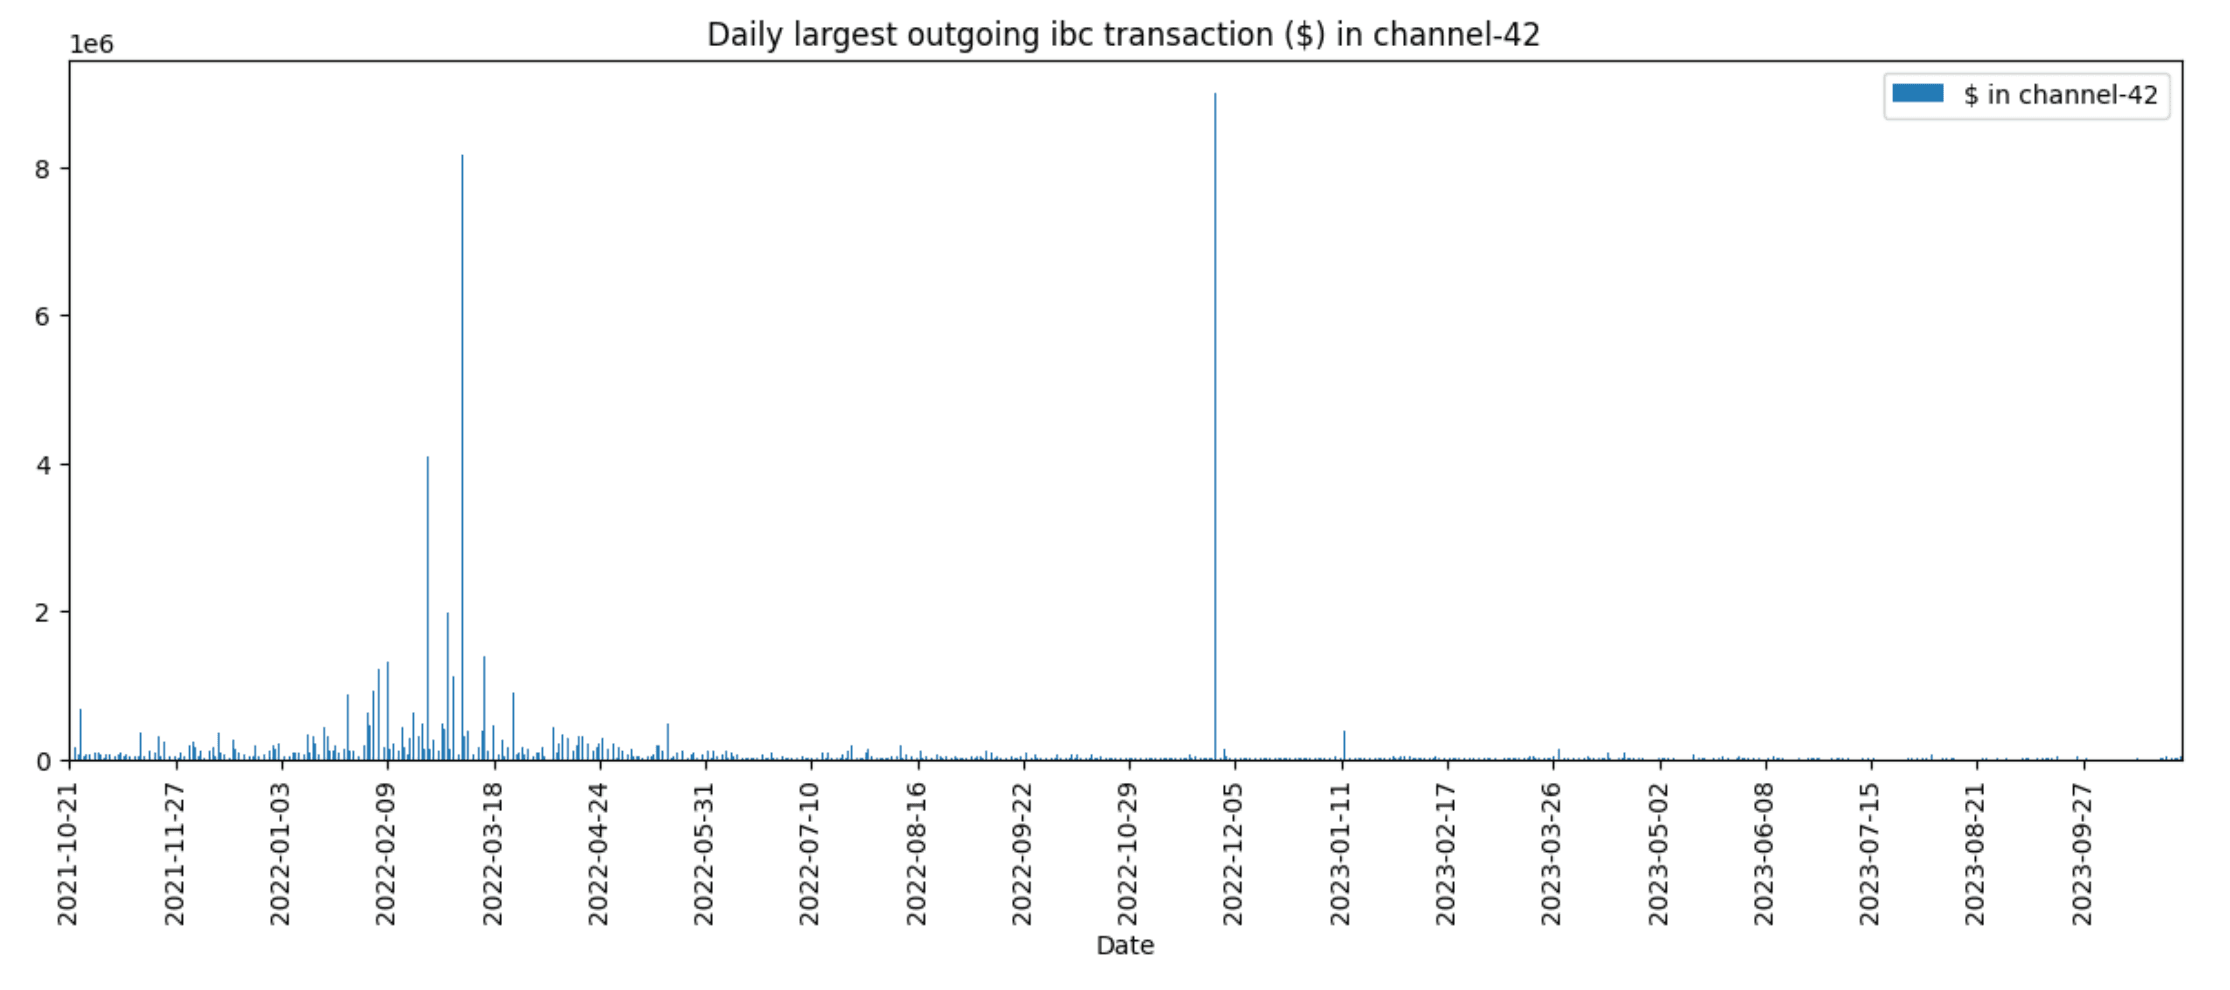
We can compare these single largest transfers per day with the historical volume in dollar terms:
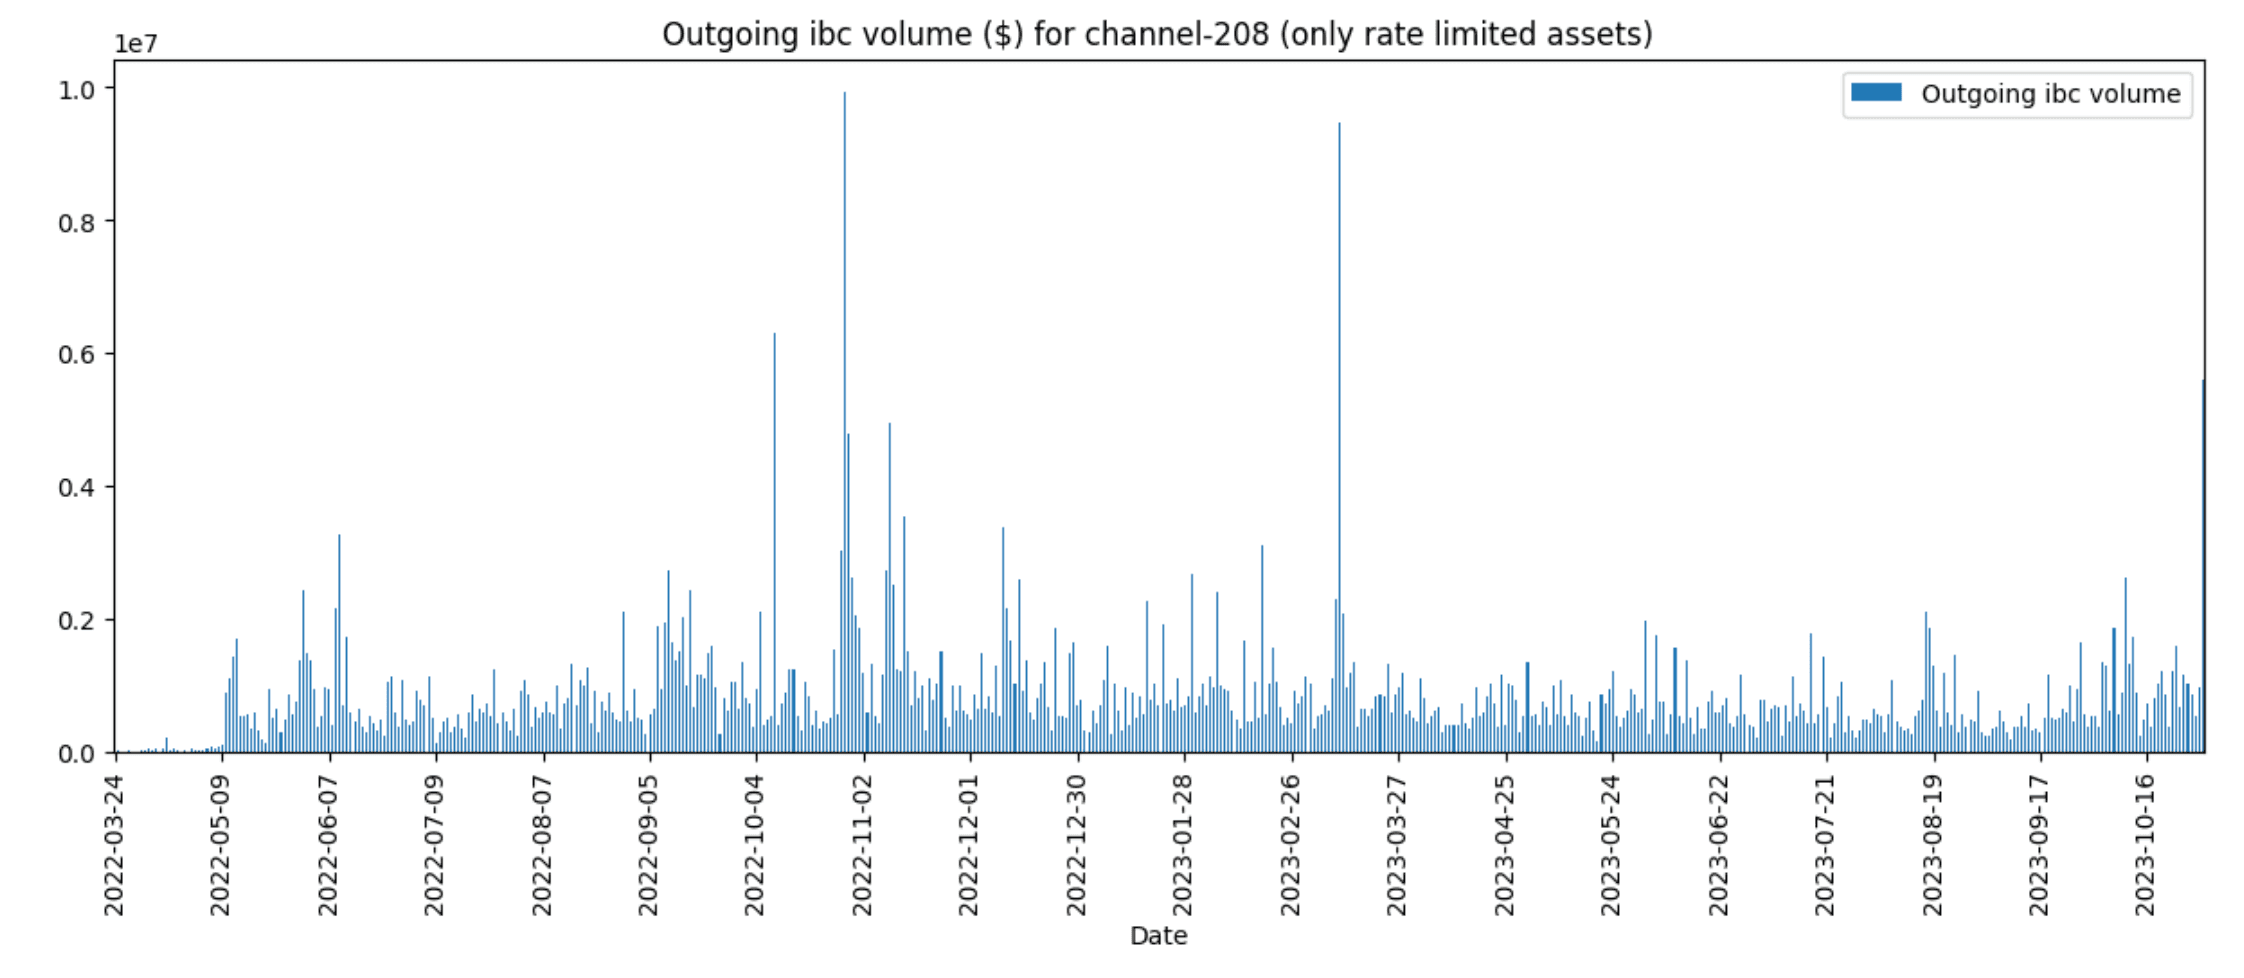
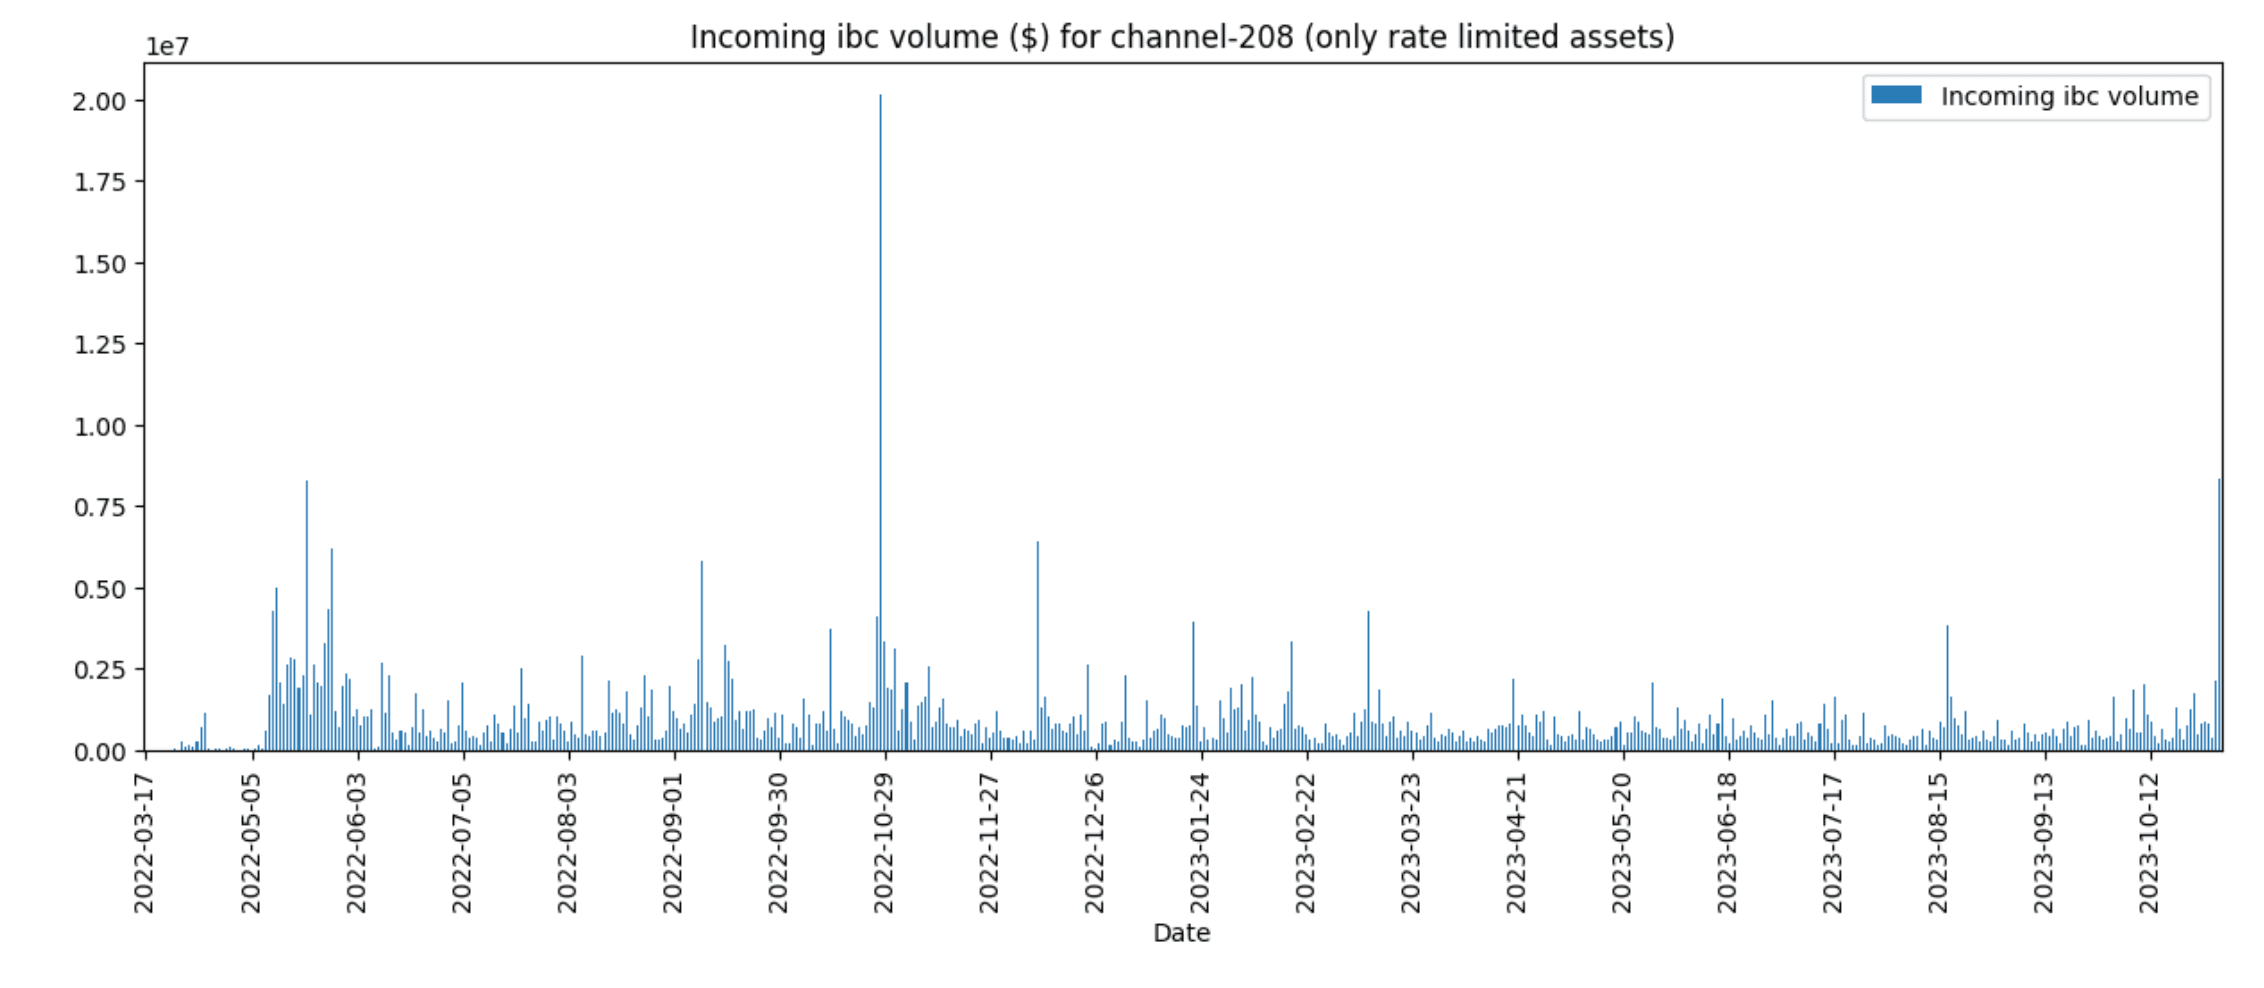
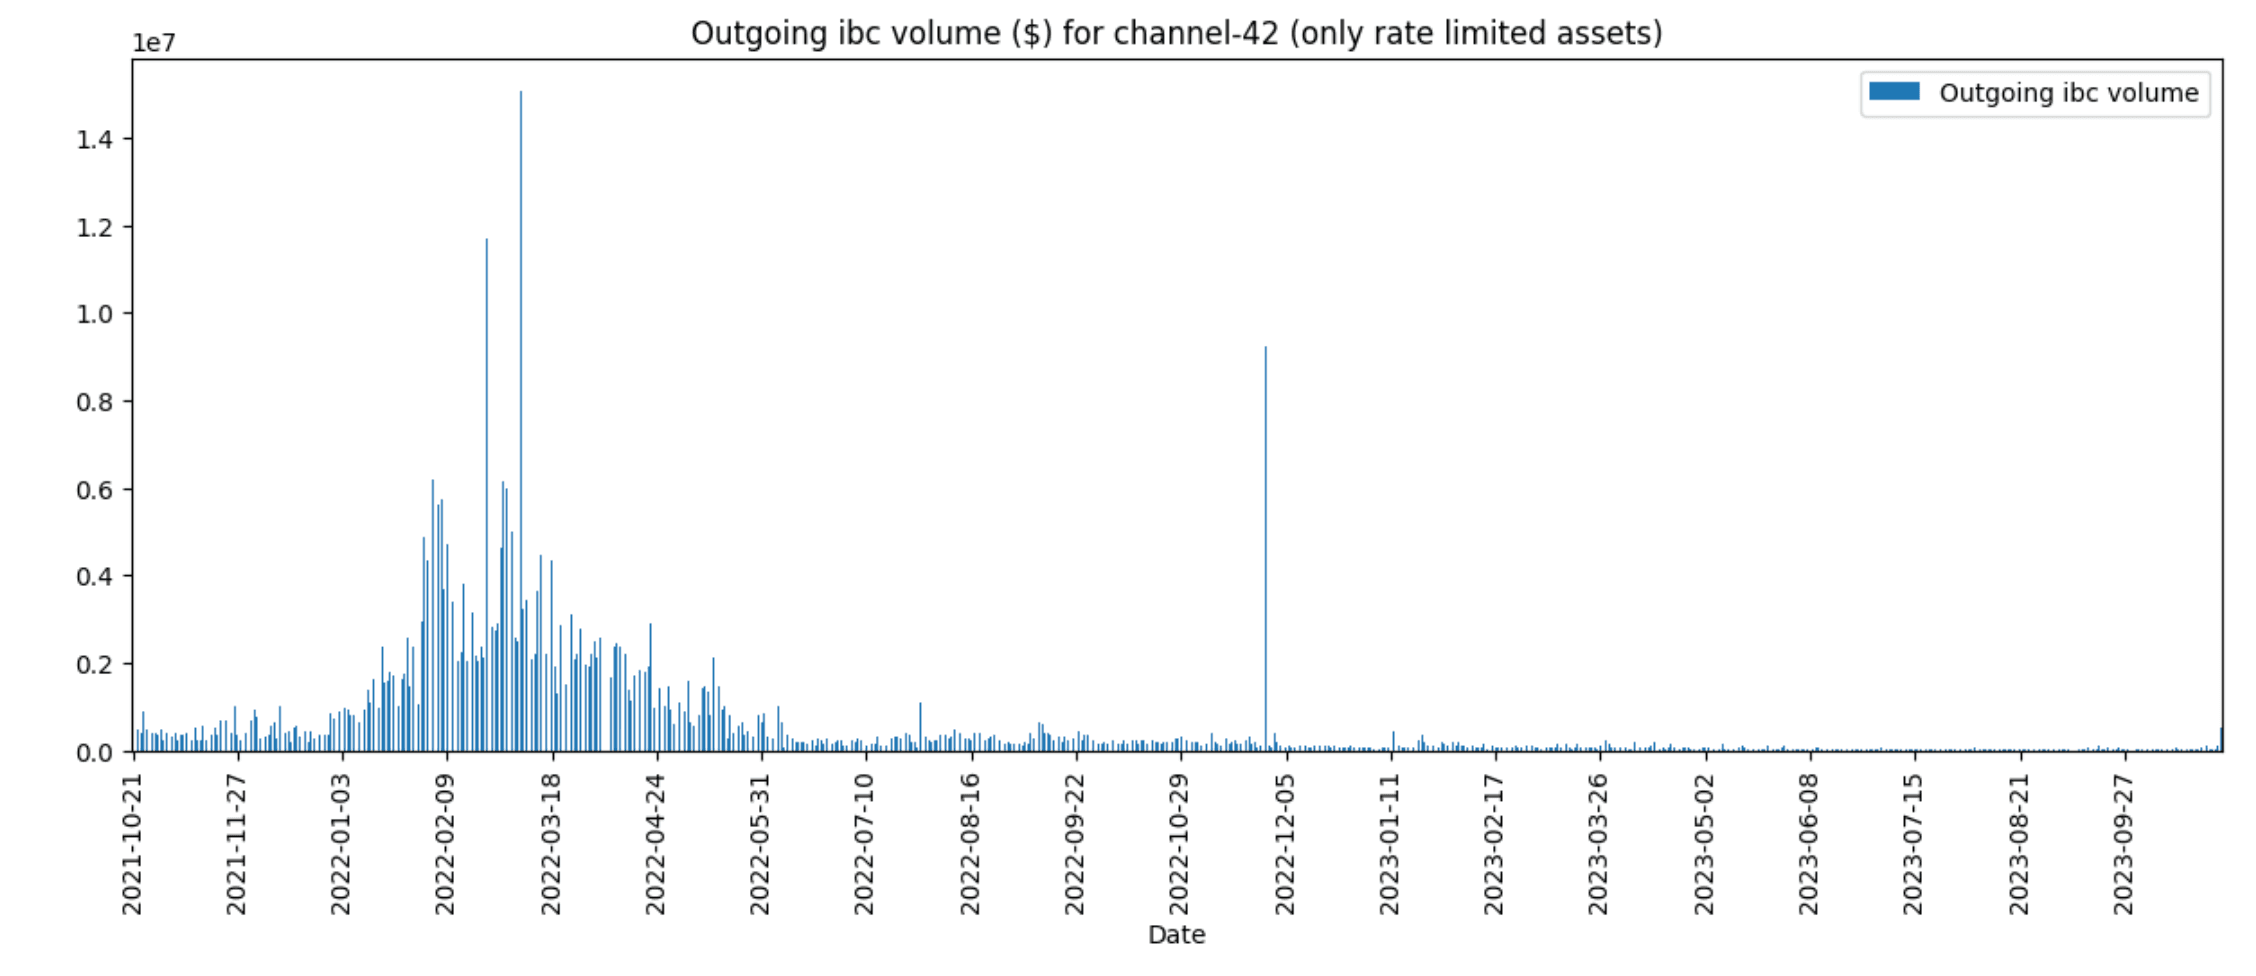
As we can see in the comparisons of the outgoing volume in channel 208 with Axelar, the largest transfers have an outsized impact on the daily volume. This could be an argument to implement a dual-lane approach for big and small transfers, similar to the Wormhole Governor.
An alternative approach to measuring the impact in volume by big traders (or whales) on the historical volumes is measuring what % of the volume can be accounted for the top X wallets over a certain period. To make it more realistic and avoid any bias across channels, we’ll look at the outgoing uosmo transfer over all studied channels:
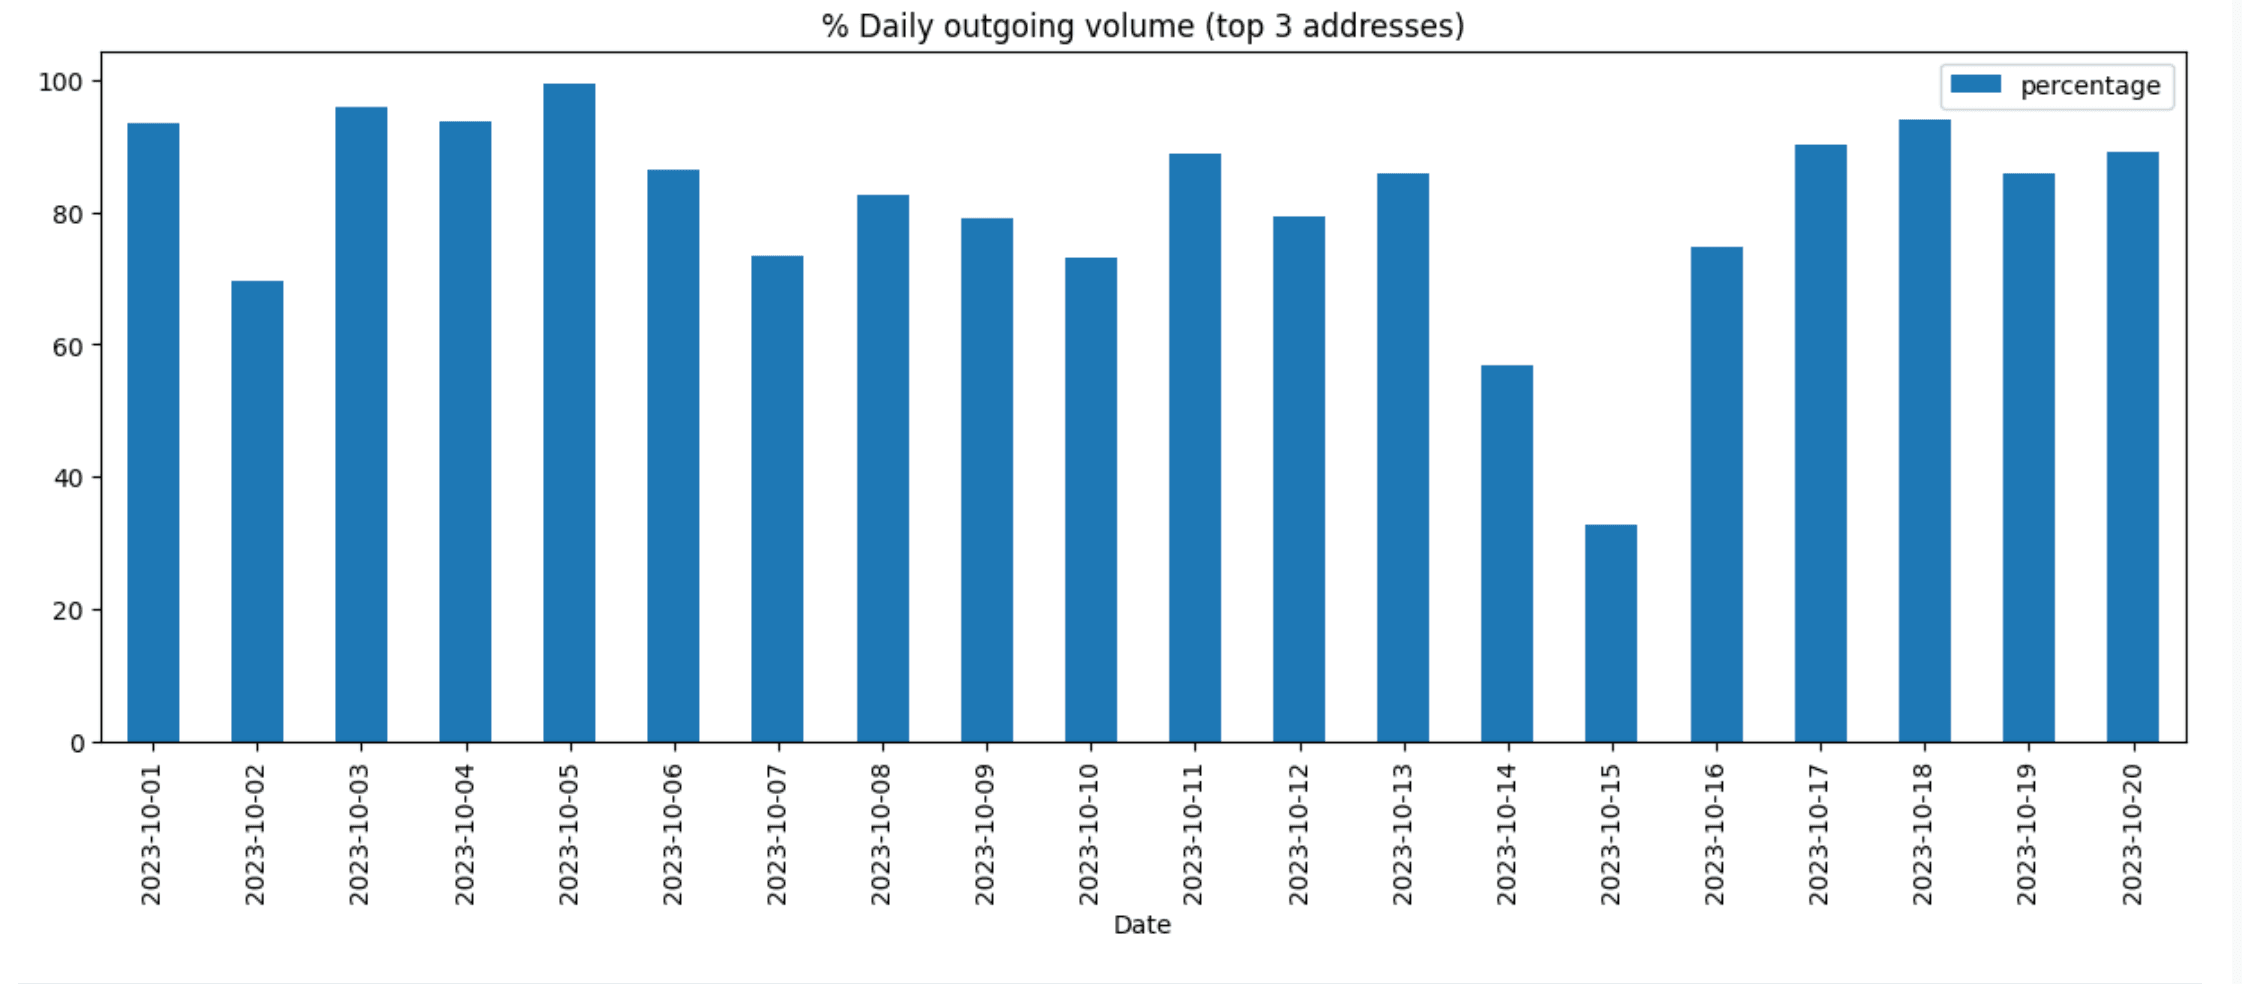
As can be seen in the graph above, the top 3 addresses by volume normally concentrate around 80% of the volume, with certain days getting close to 100%.
Now, let’s look at the supply changes of the assets with rate limits, analyzing both the supply change over time and the daily and weekly net supply changes.
Although we’ll focus on the study of the supply of non-native assets in Osmosis, it’s helpful to understand which days have seen the sharpest increases or decreases of uosmo supply living in Osmosis:
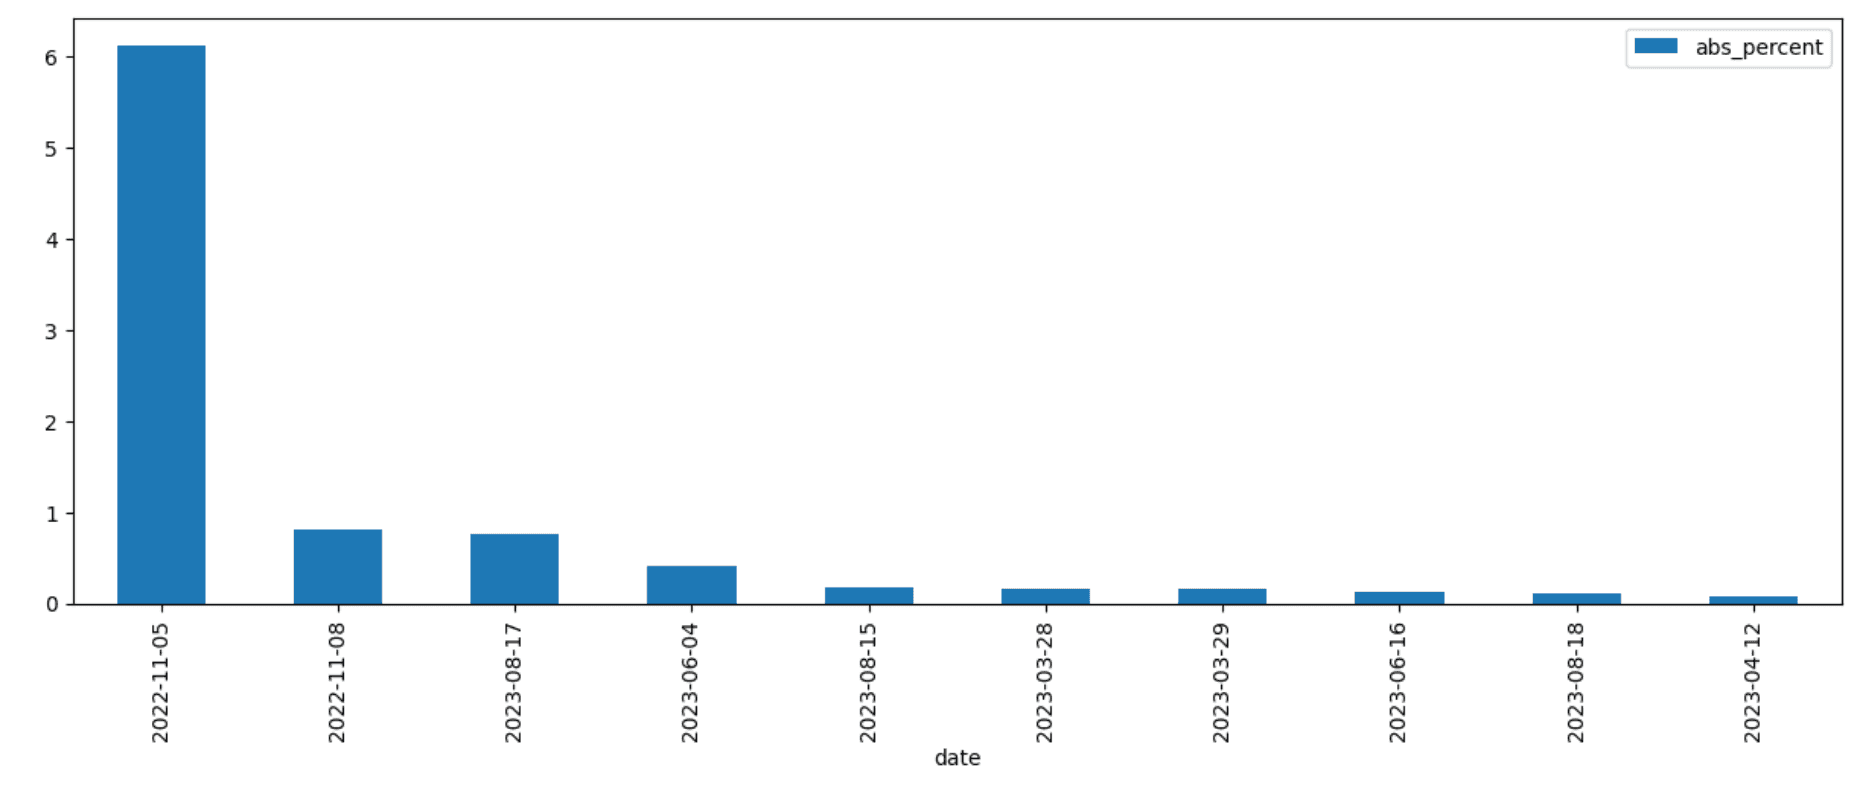
The outlier corresponds to the 5th of November 2022, reaching a 6% change, in the days before the FTX collapse.
Now, let’s look at the supply of uatom in Osmosis over time:
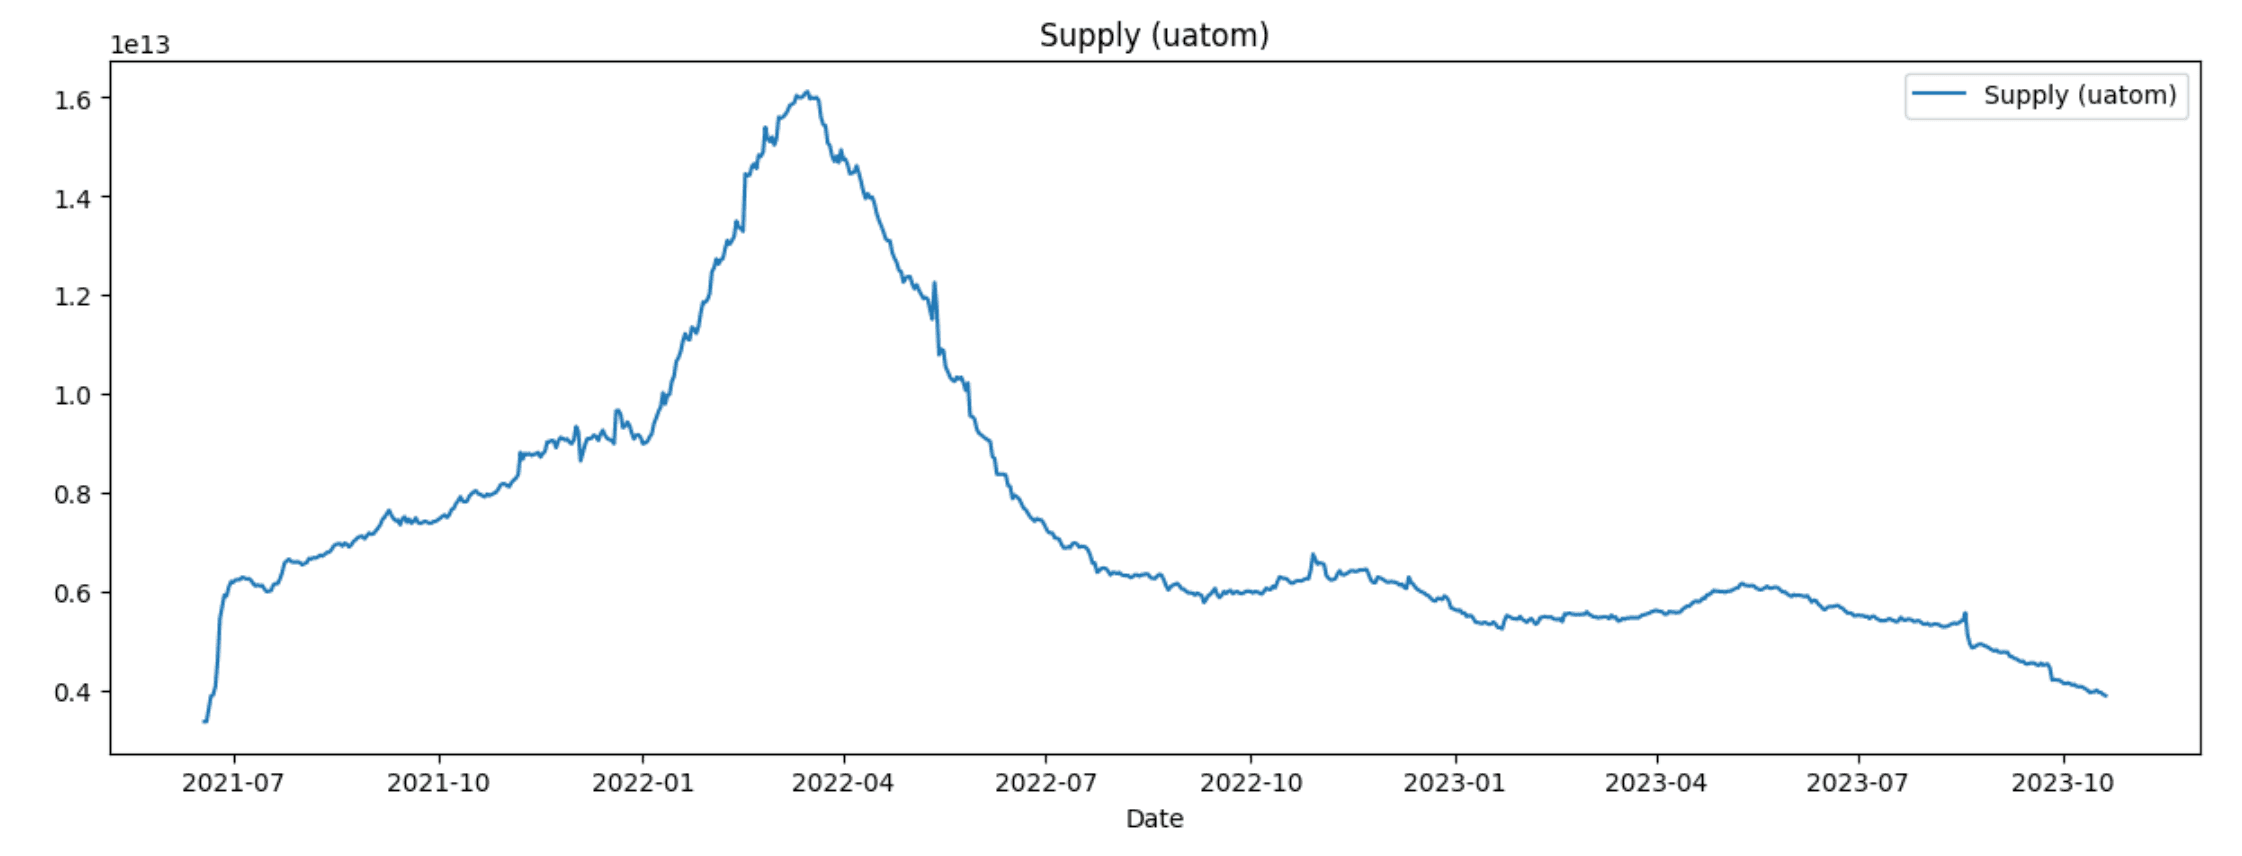
At its peak, around April 2022, the supply of atom in Osmosis crossed 16M. Then, it proceeded to decline at different rates, descending below 5M currently. Although this visualization can help understand the market health and usage of Osmosis in different periods, it’s not security relevant, as rate limits only care about sharp decreases or increases in supply over short periods of time (one day and one week).
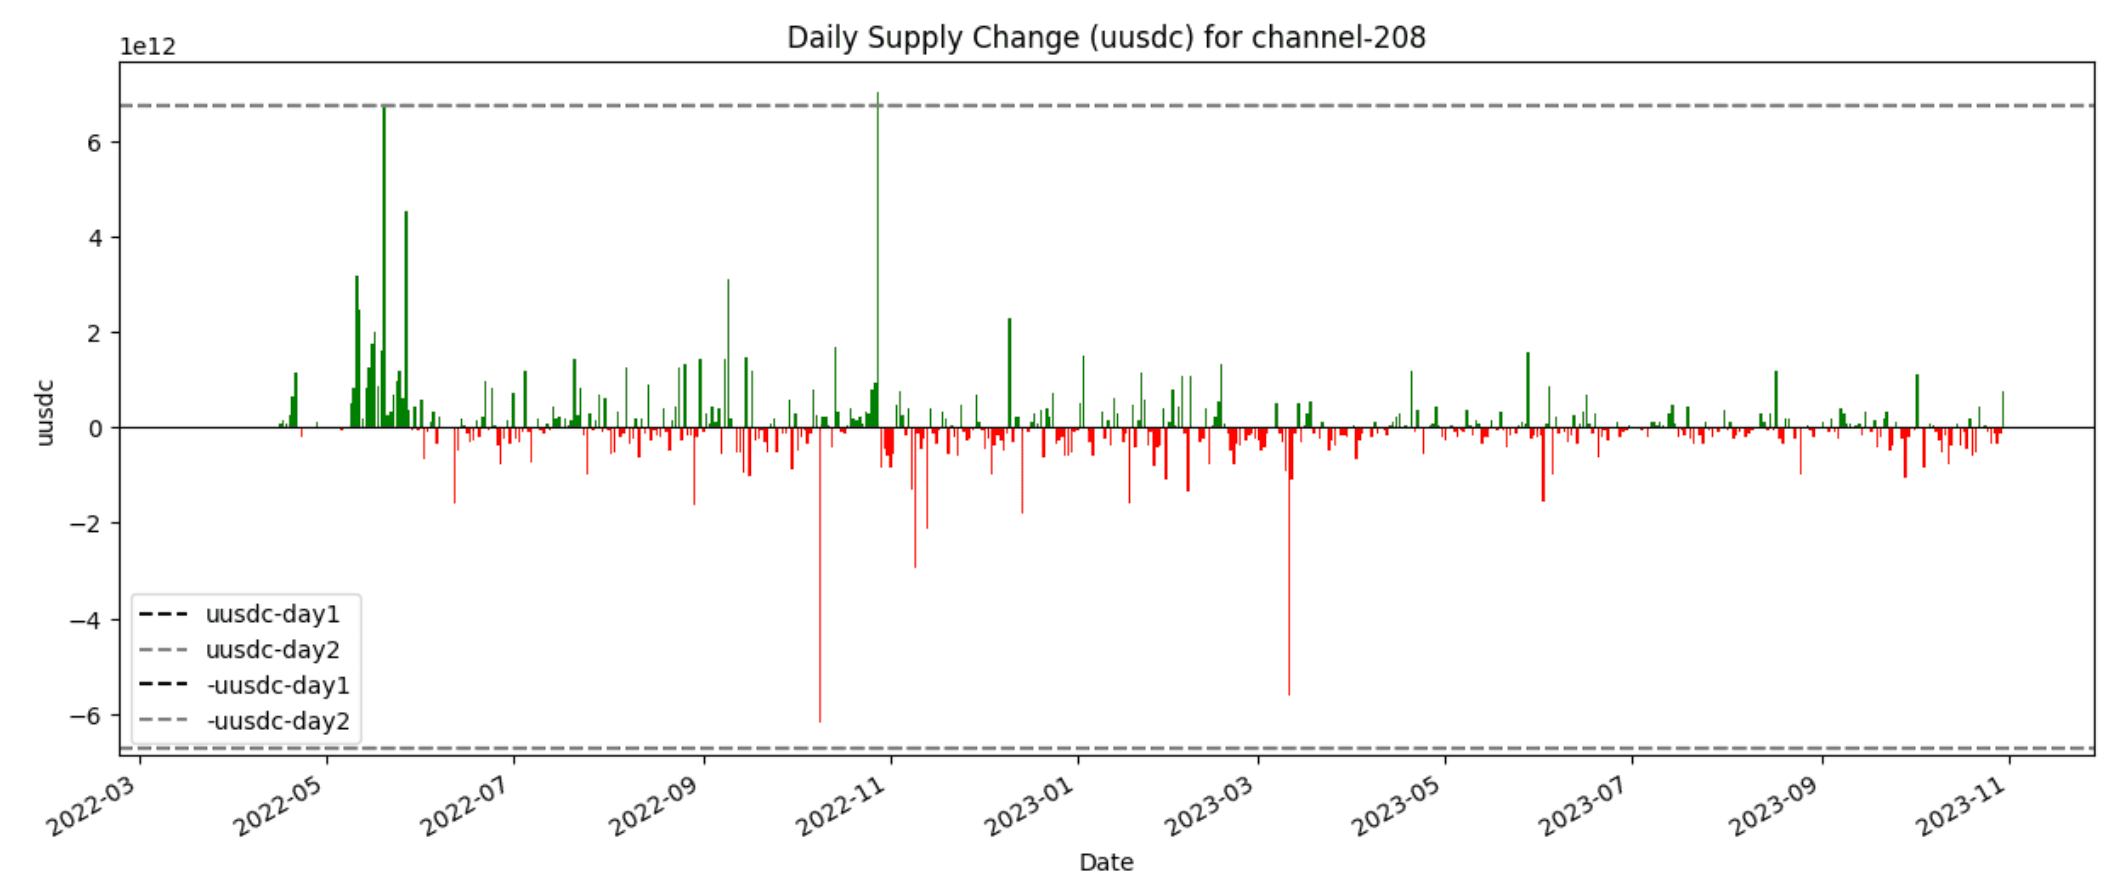
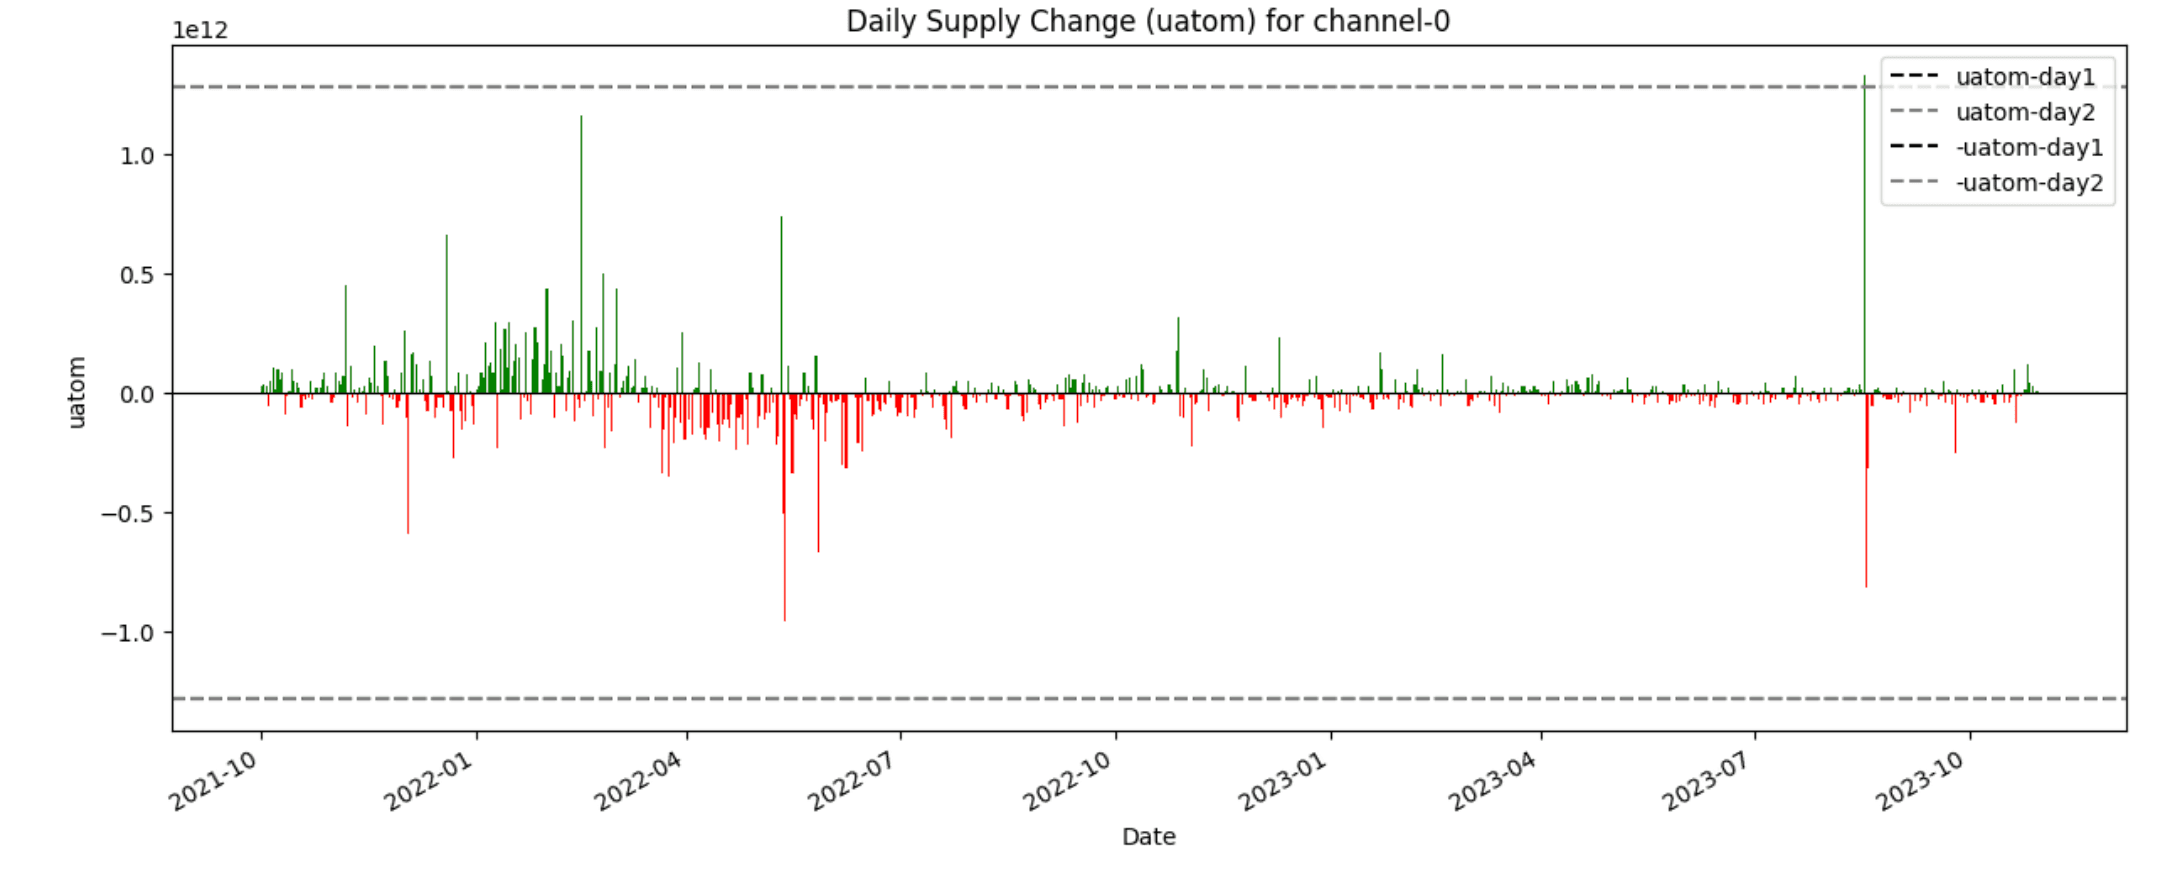
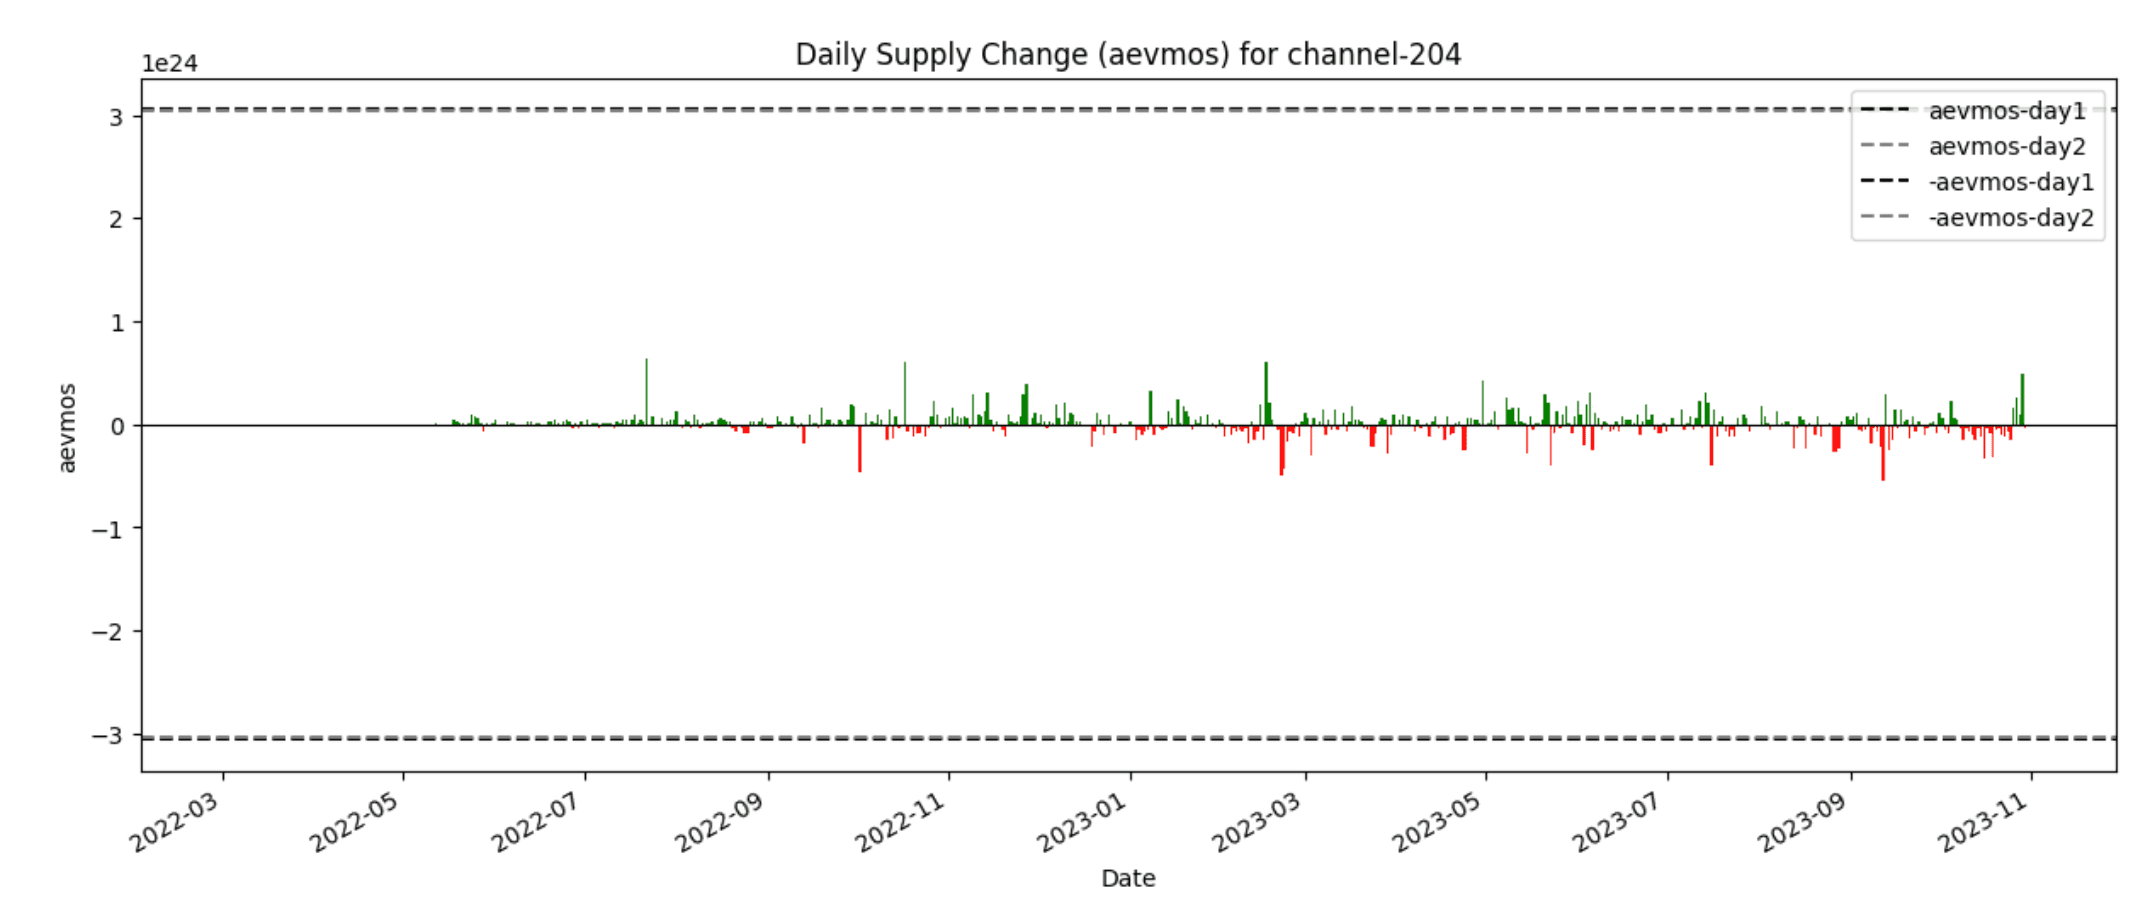
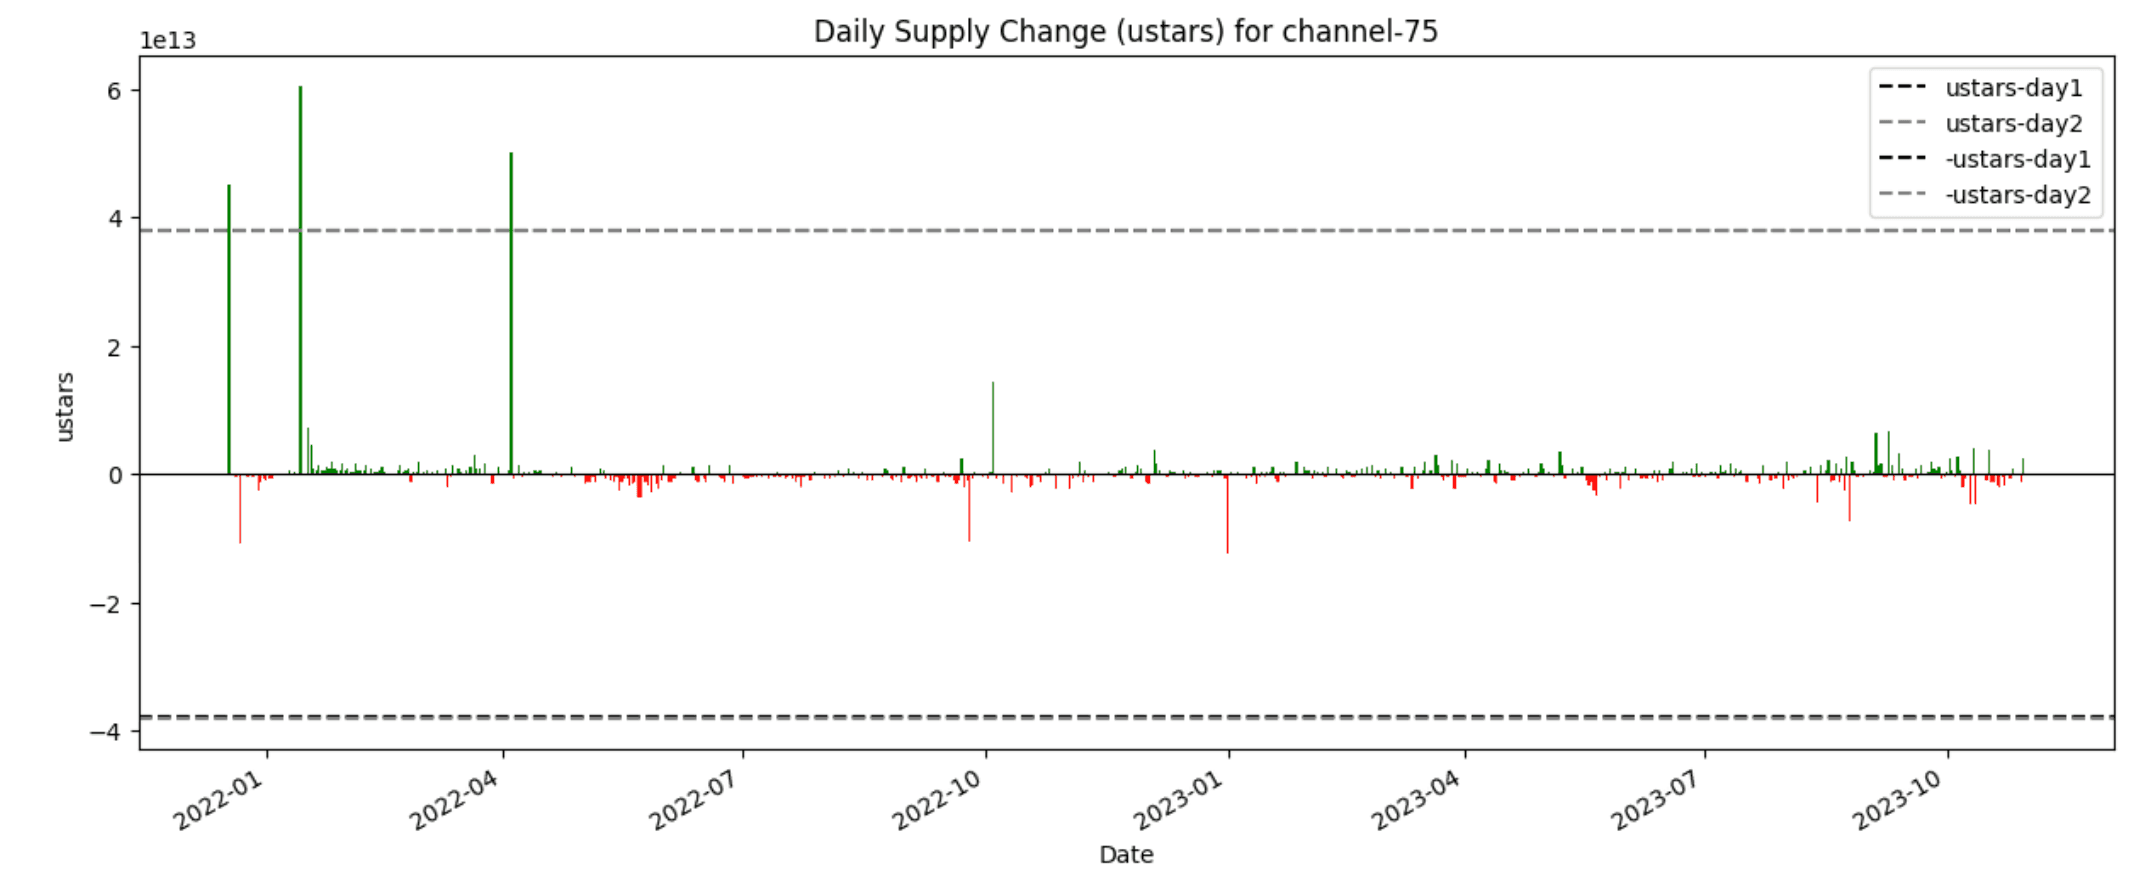
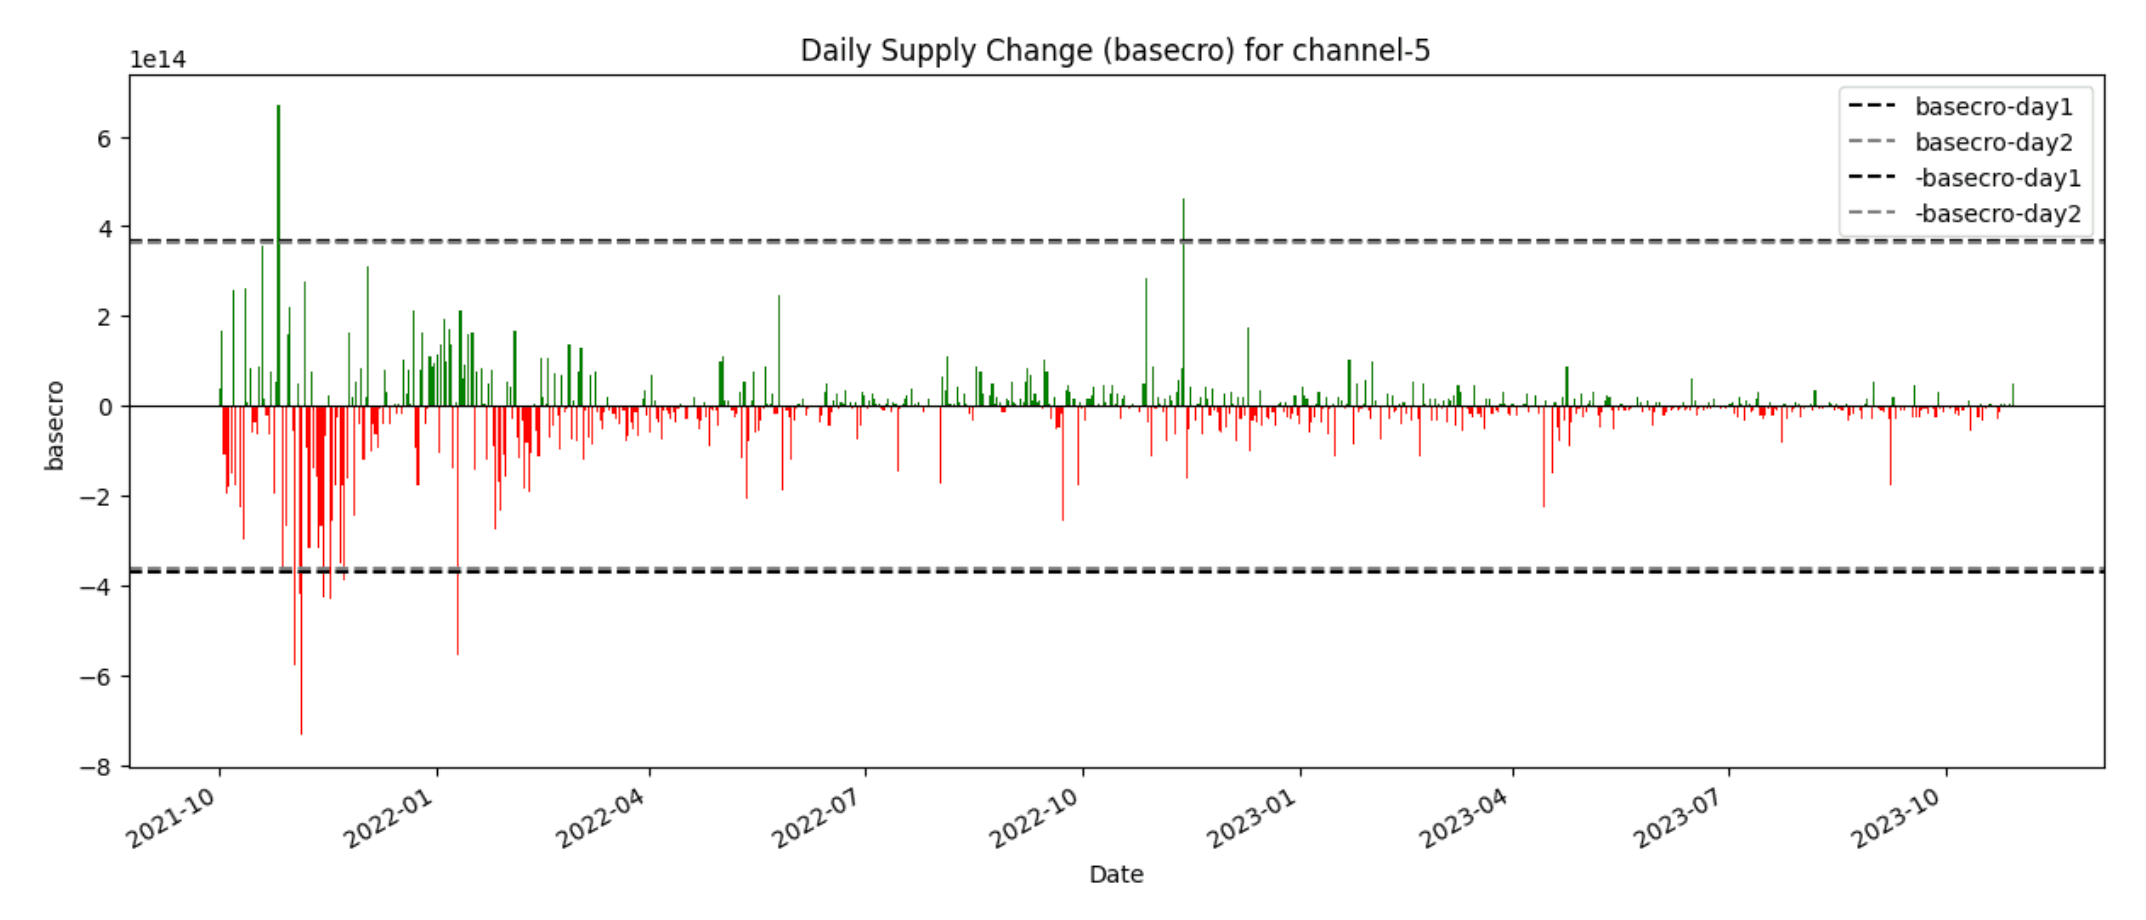
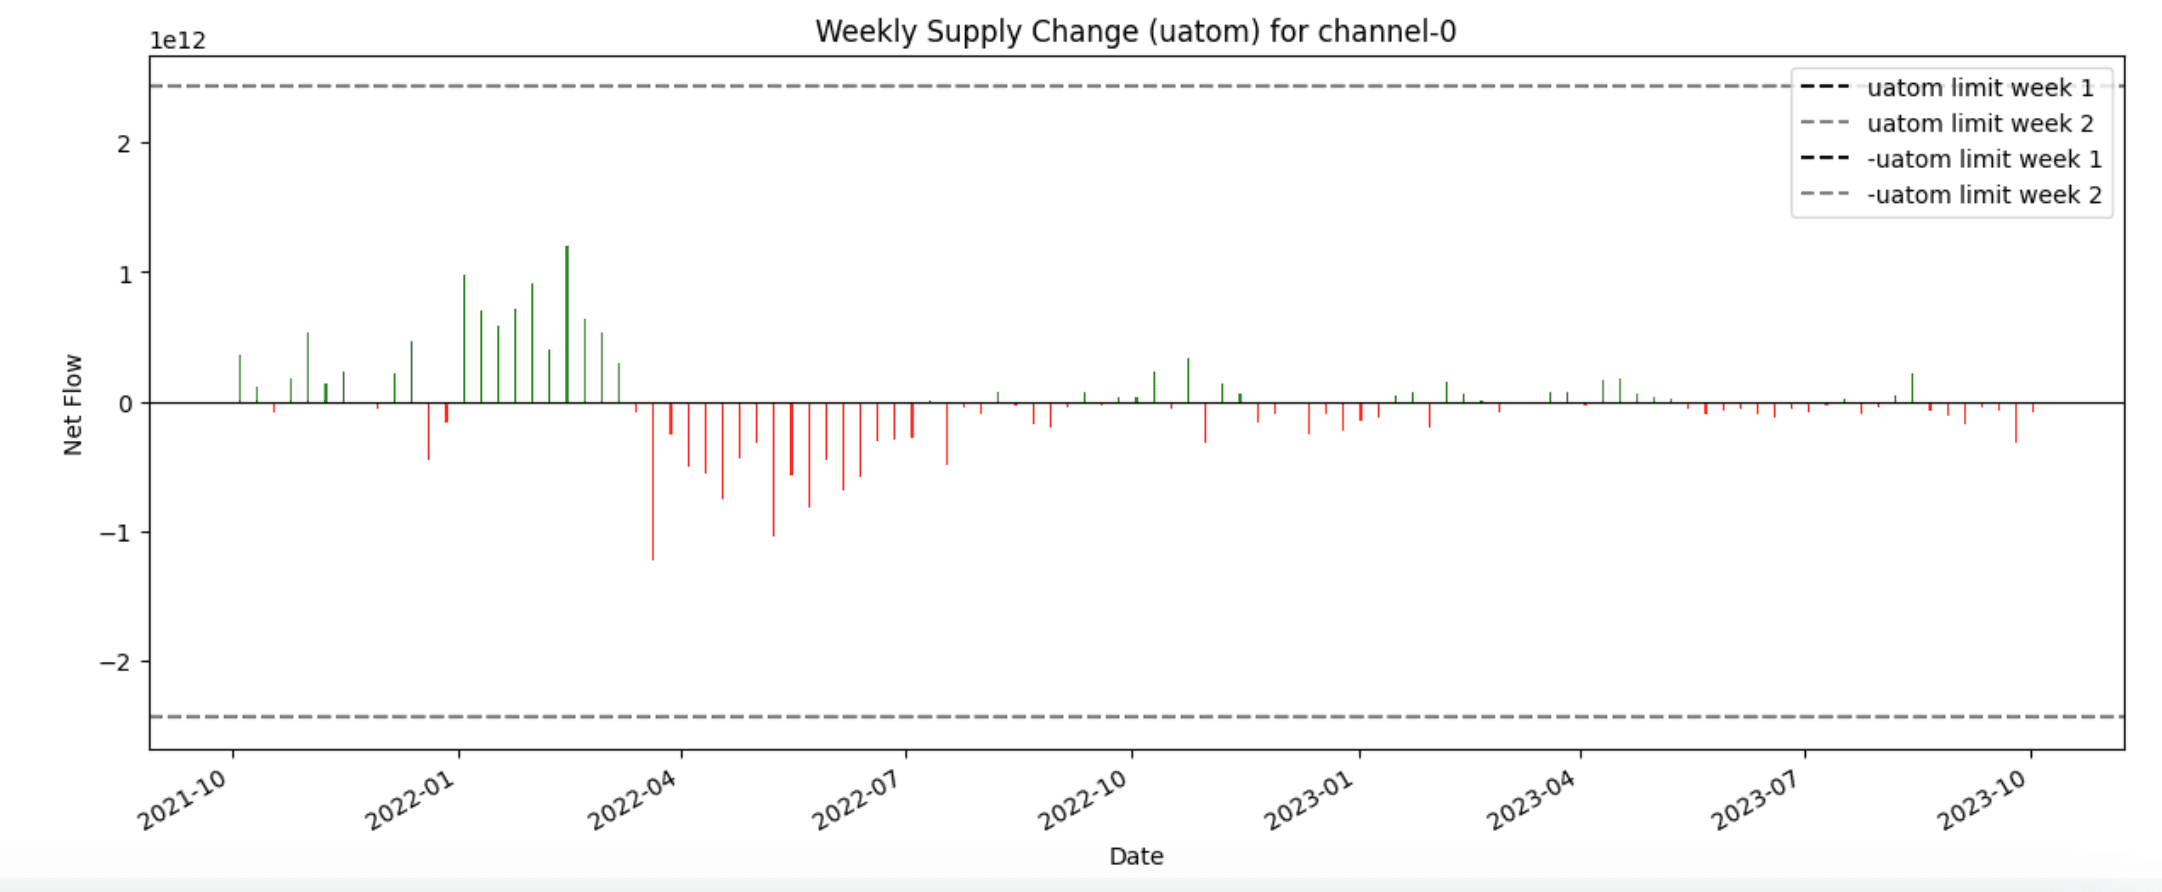
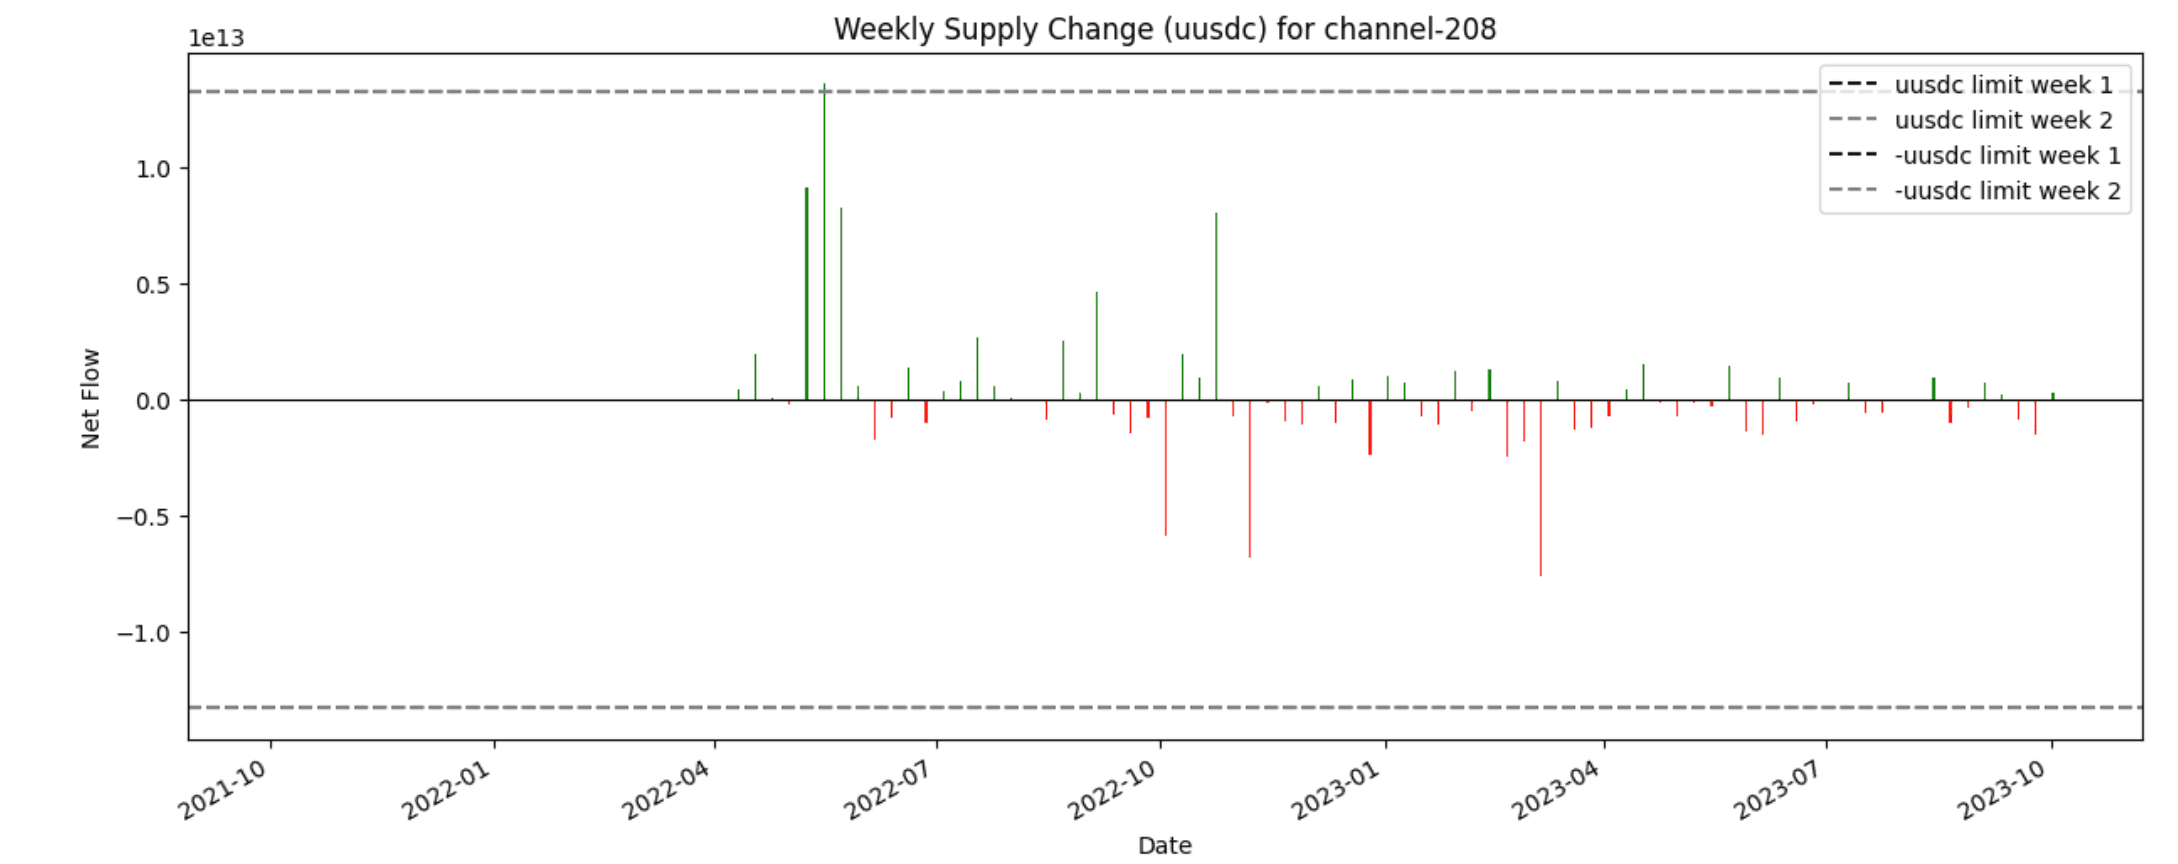
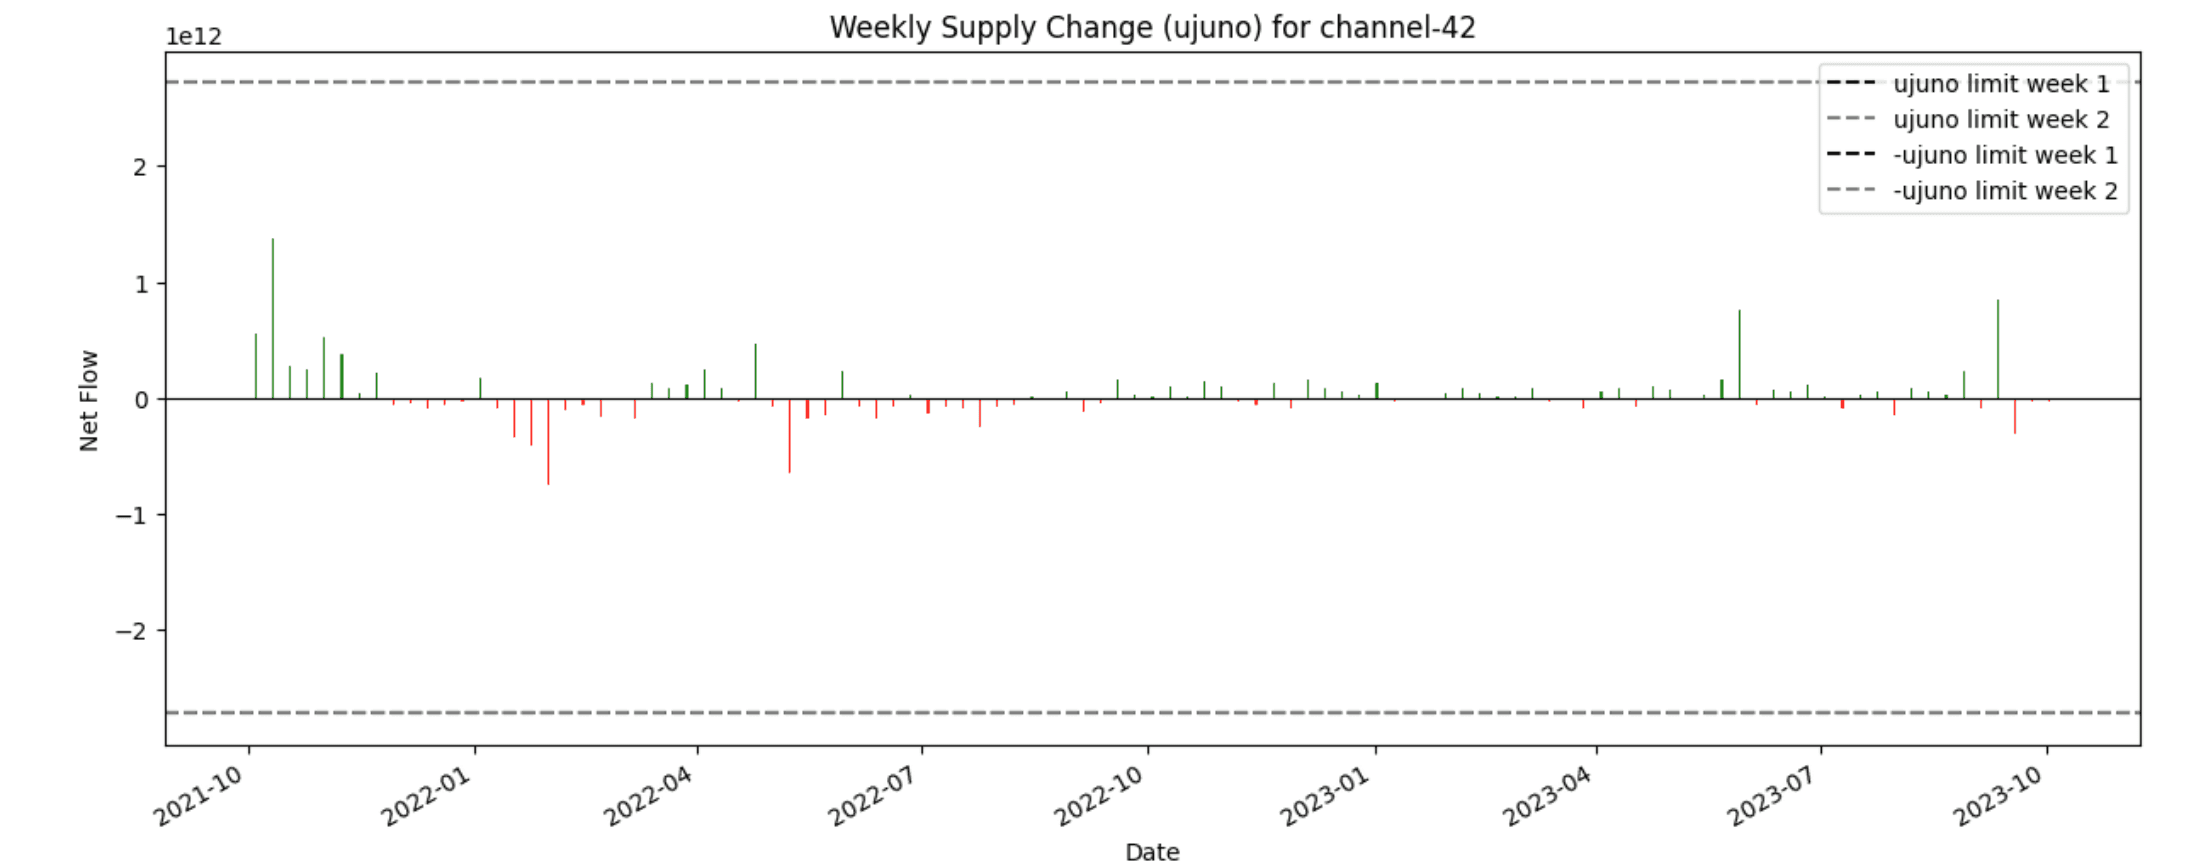
To understand the effectiveness and accuracy of the current rate limit quotas, we have plotted the daily supply change of rate-limited assets, showing the quota threshold for outgoing and incoming flows. In the graphs below, we plot the daily net inflow, showing days with positive net flow with green bars and days with negative net flow with red.
And the weekly supply changes vs weekly rate limit quotas:
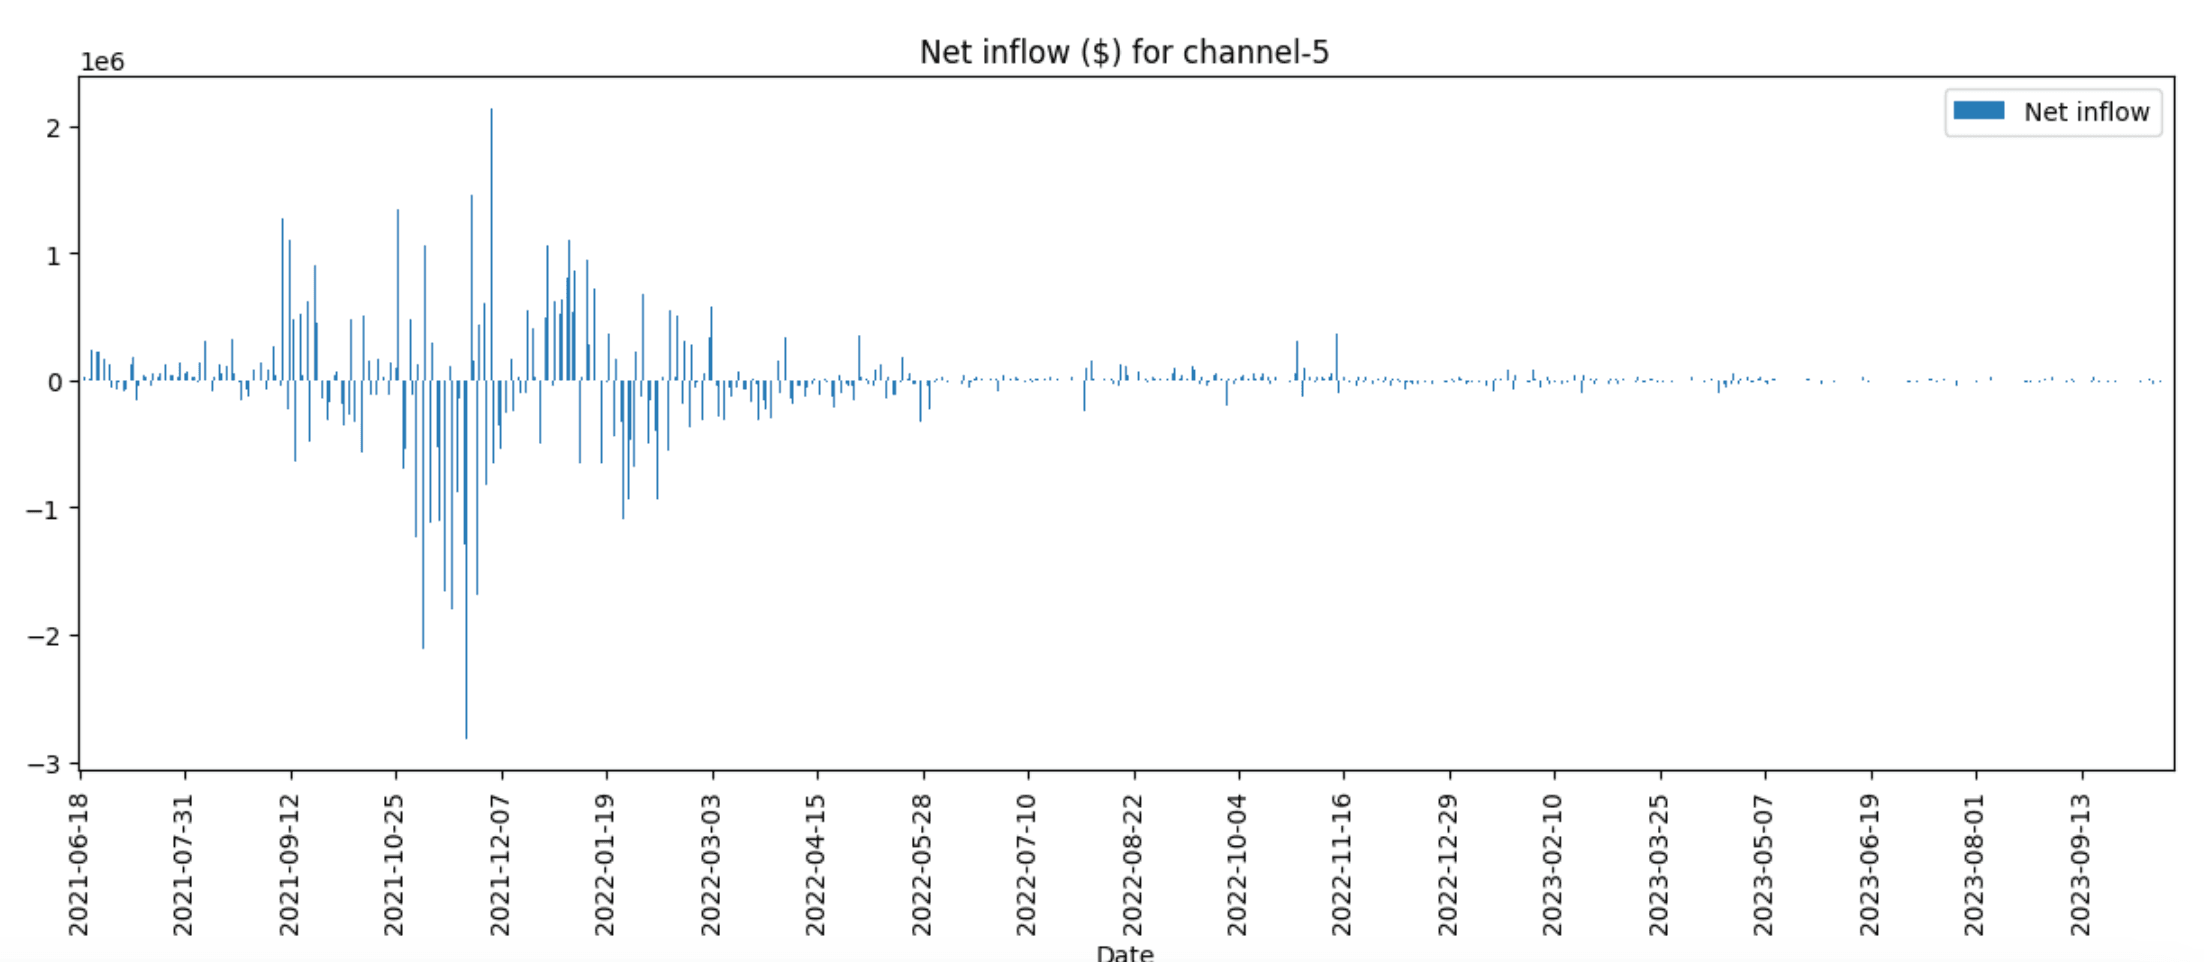
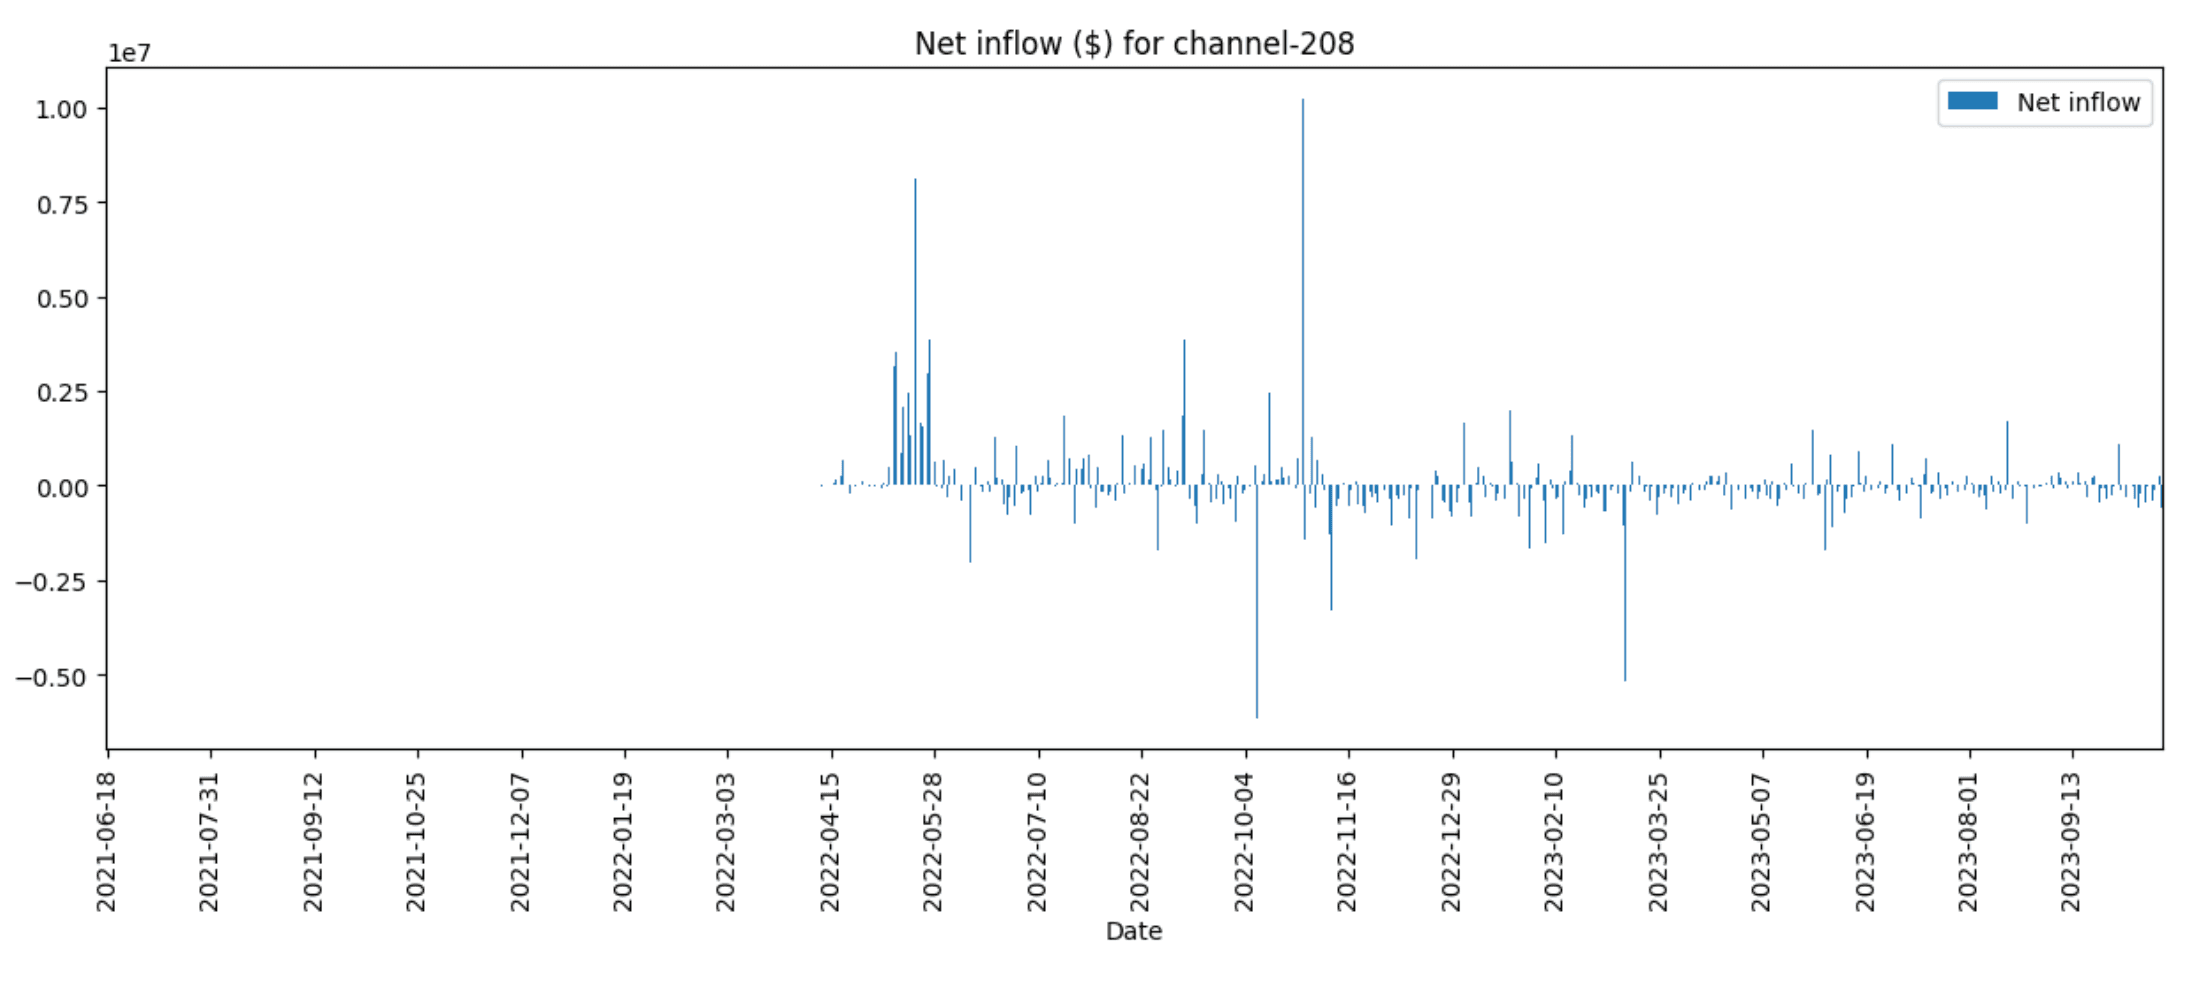
For future work, in case it was decided to set rate complementary rate limit quotas in dollar terms, we could also look at net inflows ($):
3b. Rate Limits Analysis
Based on the historical data analysis of IBC in Osmosis in the previous section, we summed up our findings and conclusions to make rate limits more effective while not sacrificing the user experience of the vast majority of users:
- The largest daily transfers represent an important share of the daily IBC volumes. Also, the top 3 and top 10 addresses alone can represent between 80 and 100% of the volumes for a given channel. As such, we recommend the implementation of dual rate-limit lanes. A similar mechanism has been implemented in Wormhole, with the Wormhole Governor. This has two clear benefits:
- Giving more security guarantees to the largest transfers. As shown above, the number of affected parties would be quite limited, so the pre-declaration of transactions would not be a degradation of user experience for the vast majority of users.
- Enabling the set up of more strict rate limits for the long tail of transfers. Since large transfers would not account for the regular net flow, rate limits could be more precise and protect the Osmosis chain against the rest of transfers which are not pre-declared by whales. This change would enhance the protection of Osmosis against hacks.
- When the rate-limited tokens decrease in value, the originally set quotas become less in tune with the original intention and actual transfer behavior. Rate limits are static and denominated in token amounts, not dollar values. Potential benefits and trade-offs of implementing dollar-denominated rate limits are described in the next section. Current in-token denominations are inefficient, given that they are static and track the true market value of the transfers. One mitigation would be to create more dynamic quotas based on the inflows and outflows of the previous periods. A simpler fix would be manually updating the quotas each month or quarter.
- Currently, two very similar quotas are set for all rate-limited assets, both daily and weekly. The intention of these is to decrease the surface of boundary attacks. We think this approach is inefficient and can be confusing for users, as each asset should have just one quota for more clarity and precision. To solve that, we recommend implementing the decay n-period average mechanism, which is further described in the next section.
- Currently, rate limit quotas for net inflows and net outflows are the same, e.g.,
max_recv = max_sent. We think Osmosis should take a more “autocratic” view, setting much more strict outflow than inflow quotas. Although setting sensible inflow quotas is important, one of the key goals of the rate limits is to minimize the damage in case an exploit were to occur on the Osmosis chain, which is the job of outflow quotas. When Osmosis was just a DEX, setting up symmetric rate limit quotas might have been the most appropriate solution, but with Osmosis hosting multiple applications with long-term value locked, this argument does not apply anymore. It should also be noted that this could have potentially positive economic effects; in the same way, bonding periods or 1-week withdrawal times in Ethereum L2 disincentivize users to bridge out their funds. - Weekly quotas seem to be much more lax than daily quotas. This could be by design or unintentional. We think that daily quotas are more critical to get right and fine-tuned, as most non-atomic attacks are detected in a period of less than 24 hours. Having said that, we have major examples like the Ronin Bridge exploit, where the team realized about the hack 6 days after the fact. That’s why we recommend adjusting the weekly quotas closer to the real net flow data.
Related reading


Protect your time and money
Try every capability with your real data in a sandbox before you commit.